

What’s New
See details here
Automation just got even better, Introducing
See details here
All updates are forever free of charge
Contact us if you need clarifications.
This is your dashboard. From here you can download, install and learn everything there is to know about our fully automated trading strategy. Please follow the steps below to get started.
The NinjaTrader guide will show you every steps needed to setup our automated strategy on your computer and how to start trading with it.
Every automated trading modes and inputs found in our strategy control panel is defined in the USER MANUAL in great details.
It is crucial that you become familiar with what each input in the strategy is about in order to start perfecting the strategy to your favorite instrument.
After going over the platform guide and user manual tabs, it is time to put what you’ve learned into practice:
1. Explore how TRADOTO fully automated trading modes trade on the chart with historical data and live data (Futures, Forex, Stock)
2. Decide which trading mode works best for your capital size/risk tolerance and start optimizing your own configuration over a few months time-frame.
3. Once you’ve come up with a strategy configuration that you like, start applying it in market replay to see it trade in real time then switch to SIM mode for a few days.
4. Finally, there will be a time where you will have full confidence in how TRADOTO trades for you and trust its consistency/reliability. From that point forward, you can start trading LIVE with real money!
Download the latest NT8 version and install it using the default settings.
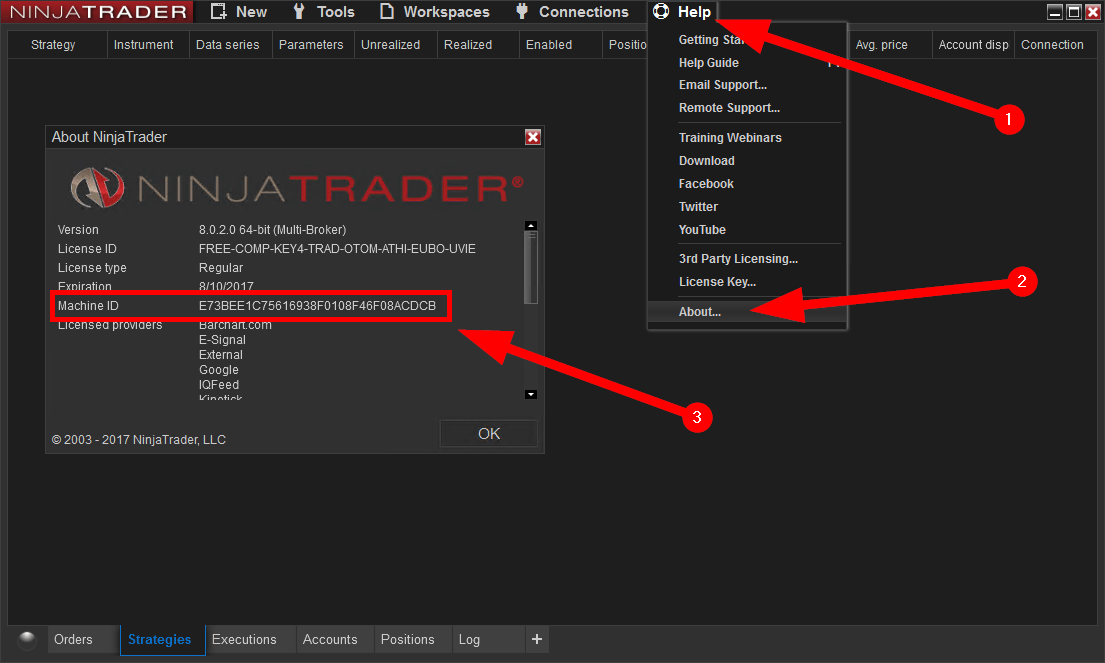
We require your Ninja Trader MachineID in order to enable your use of the TRADOTO strategy that you purchased from us. Use the form below to submit it.
That information can be found from the Help > About menu in NinjaTrader. It is a string of 32 alphanumeric characters, with no dashes. Please be sure that you do not submit your NinjaTrader License ID.
The TRADOTO strategy can be licensed and used on one machines. If you plan to upgrade your computer hardware or replace it with a new one, you must resubmit your new MachineID to us before the strategy can be used again.
If you need to run TRADOTO on two platforms simultaneously, you can add a second and third machine ID to your account by purchasing it HERE
You can download the latest version of TRADOTO and review our strategy change log below. We also email all active members every time we release a new version.
Version 5.0 (New - August 2021)
NEW TRADING MODE
– New trading mode leveraging the popular Pivot indicator. You can now trade your favorite support and resistance pivots levels fully automated with our fully featured order management Algorithm, enjoy!
NEW FEATURE
– Revamped strategy layout to speed up learning curve and facilitate optimization
– You can now enter on pullback with a pre defined offset to optimize your entry price event more!
– New input to let you ignore cloud position in relation to price to increase trading flexibility when using the Ichimoku trading mode
– You can now trail your stop based on the last support or resistance level!
– Added new input to avoid entry on choppy price action when using the swing trading mode
– New algorithm to close a partially filled entry position when STOP/TARGET is hit to avoid having a re-entry on the remaining unfilled position.
– Added new input to bypass T/K alignment when using the Cloud Break Trader
– HiLo trader filtering input can now be applied globally to all trading modes
– Swing entry offset can now be used with a negative value to place trades before support or resistance levels are broken
– Improved fill accuracy with TopStepTrader pre-funded accounts
Version 4.0
NEW TRADING MODE
– Introducing two brand new trading modes leveraging the Ichimoku indicator, see user manual for all the details.
NEW FEATURE
– New and improved strategy control panel layout
– Brand new trading mode to leverage the popular ichimoku indicator
– New input to let you trade in one direction, short or long. This can be helpful in some markets where you see that the daily chart is extremely bearish or bullish.
– New merged trading execution mode to let you see historical trades while trading LIVE
– You can now specify your position sizing in quantity or “Capital to risk” to let TRADOTO dynamically calculate the number of contract/shares to buy depending on the capital entered.
– You like to use percentage to calculate how far your target an stop should be? you can now do that thanks to the “Target/Stop calculation method” input.
– Added input to pause the strategy X number of bars between trades to avoid over-trading when using lower timeframes.
– You can now define the minimum squeeze duration before the strategy is turned on.
– Added input to either close position at the last time filter only or all the time even between time filters.
– New order exit method leveraging the Ichimoku indicator for improved trailing method.
– HiLo trader filtering input can now be applied globally to all trading modes
– Swing entry offset can now be used with a negative value to place trades before support or resistance levels are broken
– v4.0.1.6: Added new input to bypass T/K alignment when using the Cloud Break Trader
– v4.0.1.14: Implement new algorithm to close a partially filled entry position when STOP/TARGET is hit to avoid having a re-entry on the remaining unfilled position.
BUGFIX
– v4.0.1.5: Fix input naming typo and resolve minor conflict when combining the hilo filtering with itchimoku
– v4.0.1.6: Fix HiLo filtering conflict when used with other trading indicator modes
– v4.0.1.9: Fix historical trading engine inaccuracy with stops and tailing caused by the latest NT platform version update.
– v4.0.1.12: Improve partial fills handling when using stop limit entries
– v4.0.1.14: Resolve error when enabling news filter
– v4.0.1.16: Resolve PnL sync issue with TopStepTrader Data feed
Version 3.0.1.15
NEW FEATURE
– Added Squeeze box to the chart in order to easily visualize when the market is in squeeze (default when using the TRADOTO template)
– Added new ROLLOVER indicator: Shows a button on the chart in the upper right corner to roll the instrument to the front month (default when using the TRADOTO template)
– Added market economic news filters to easily cancel trading when the market is volatile
– Added a new “Economic News Filtering” trading mode to trade market economic news events
– Added input to leave open position open when the end time filter is reached to let ongoing trade close via STOP or TARGET
– Added input to pause the strategy when a trade ended using HiLo trader to avoid overtrading situations if the price stays within the entry zone for too long
BUGFIX
– Optimizes the order management engine to improve speed and accuracy when working with high volatility markets.
– Recode how the order management handles stops distance to allow the stop to be placed closer to the entry point (useful when trading forex)
Version 2.1.0.2
NEW FEATURE
– Added info message next to PnL counter in lower left corner when daily max profit/loss is reached: “Daily Limit reached – trading stopped”
– Added pop up error message when disabling strategy with open position: “Strategy disabled with open position – check your position to be sure it is as you desire”
– Added pop up error message when strategy is unable to fill an order due to a platform or brokerage problem: “Strategy stopped due to rejected entry order – verify that you are flat”
BUGFIX
– Error handling engine has been revised from [cancel everything & close position] to only ignore errors as this was introducing conflicts with the platform default error handling actions.
– Resolved issue where a time filter or stop order was rejected resulting in open positions
Version 2.1.0.1
NEW FEATURE
– A brand new trading mode is being introduced called HiLo Trader. It allows the strategy to trade of HiLo Crossovers. More details can be found in the User Manual.
– Indicators can now be plotted on the chart while using the Strategy Analyzer window by enabling the “Add indicators to chart?” under the DATA SERIES section.
– The control panel layout has been revamped to bring the most accessed section to the top.
BUGFIX
– We’ve resovled a bug that was causing the strategy to crash by trying to submit an order in historical mode instead of real-time while connected to SIM.
Version 2.0.14.0
BUGFIX
– NinjaTrader version 8.0.5.2 introduces new codes for order management on strategies. We’ve included those new languages to be fully compatible with this latest release
Version 2.0.10.0
NEW FEATURE
– Strategy Analyzer back-testing reliability has been improved in the latest version of Ninjatrader 8.0.5.2, our strategy code has now been updated to fully take advantage of this tool (see STRATEGY OPTIMIZATION tab for more details)
BUGFIX
– Resolve a bug where the strategy was trying to cancel an order already pending cancellation.
– Fixed a HiLo indicator sound alert option that wasn’t working.
Version 2.0.8.0
NEW FEATURE
– Improved layout to speed up enabling and disabling the strategy from the chart. The most useful sections are now pinned to the top and least useful ones moved to the bottom. Please review the user manual for clarification.
BUGFIX
– Resolve an issue where the breakeven PnL feature would be stuck in a loop
– Enabling the squeeze indicator was preventing the strategy from running
Version 2.0.6.0
NEW FEATURE
– Automatically close active and pending trades after the platform loses connection to the exchange and reconnect. To enable this new feature, be sure to enable the KEEP RUNNING handling feature as detailed on the CHANGE OPTIONS starting guide tab.
BUGFIX
– Resolve intermittent issue where a position is left without stop loss and targets.
– Correct Closed PnL syncing issue when a trade is closed after reaching time filter end time.
Version 2.0
NINJATRADER 8
Our strategy is now compatible with NinjaTrader 8.
STRATEGY TEMPLATES
This was our most requested feature, the ability to save and load templates to speed up the optimization process, we’ve now added support for templates, enjoy!
OPPOSITE MODE
We were seeing a lot of trading opportunities where taking reversal trades was very profitable in certain trading hours and with the right offset for entry. This feature will let the strategy place a LONG trade where it would usually go SHORT or go SHORT where a LONG would occur.
REAL TIME PNL MONITORING
Previously the STOP and TARGET PnL was acting only on the realized PnL (closed trades), this often made the strategy go beyond the max loss/profit on the day by ignoring ongoing/unrealized trades. Starting in version 2, the PnL management will be done in real time by actively monitoring the unrealized PnL as well.
PNL BREAK EVEN & TRAILING
This new feature adds break end and trailing to the daily target PnL as soon as the combined unrealized/realized target PnL is reached on the day. This will avoid being in the green at the start of the day but ending the day in the red.
Version 1.0
This is the only version compatible with NinjaTrader 7. If you would rather use our strategy on NT7, please follow the V1 Starting Guide and review the V1 User Manual linked below. We still provide BUGFIX support for version 1 but new features are only added for the NT8 platform going forward as the coding is drastically different between NT7 and NT8..
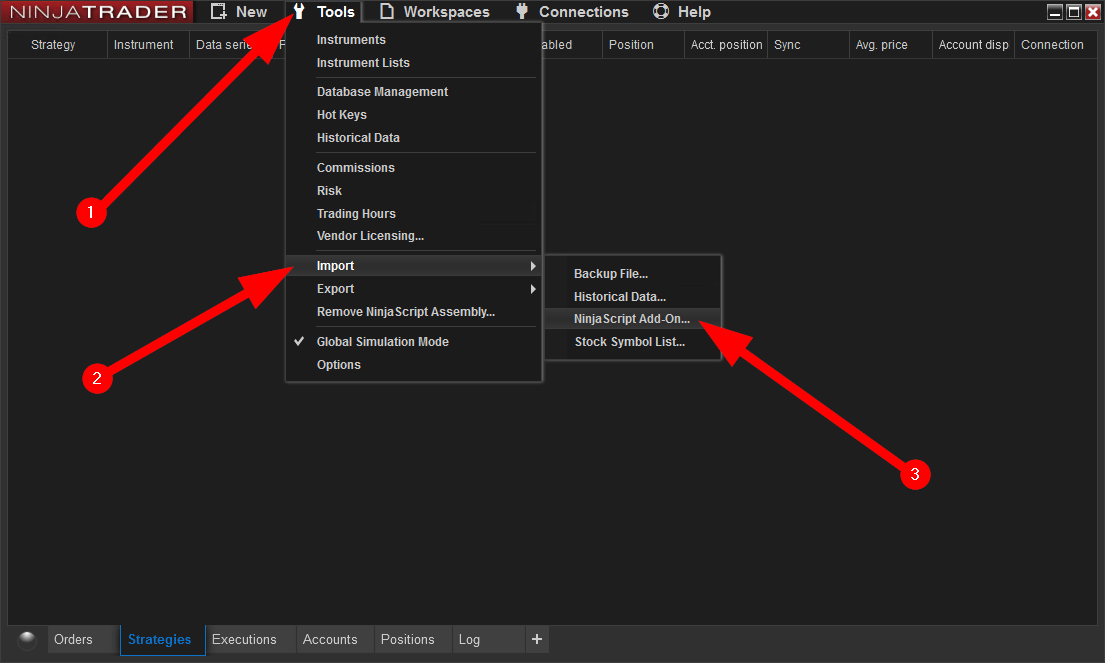
Follow the steps pictured below to import your strategy ZIP file, after step 3 pictured below, find the TRADOTO ZIP file and open it to start the import process. After the import complete, restart the NinjaTrader platform
If you are upgrading to a newer version of our strategy, you might encounter this error upon importing the strategy.
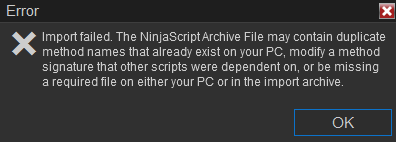
To avoid this problem, ensure you have removed any strategy added on charts or from the strategy tab. Then follow the steps below:
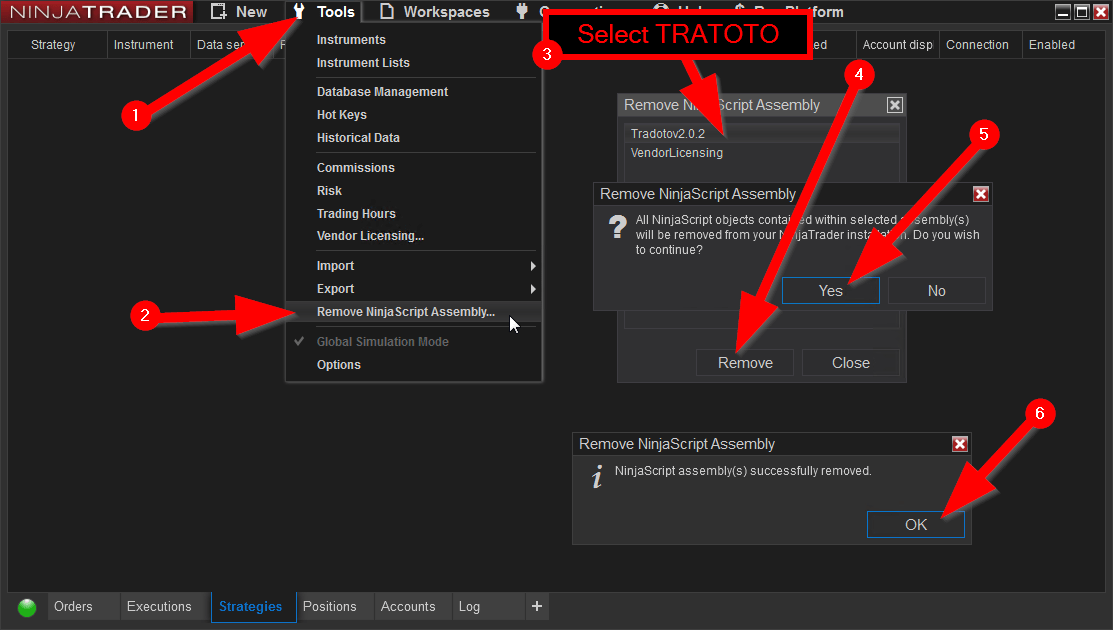
If the import is still failing after removing the NinjaScript Assembly as shown above, please manually remove the strategy files as follow.
Lastly, if both solutions above didn’t help, please perform a NT8 factory reset as shown below:
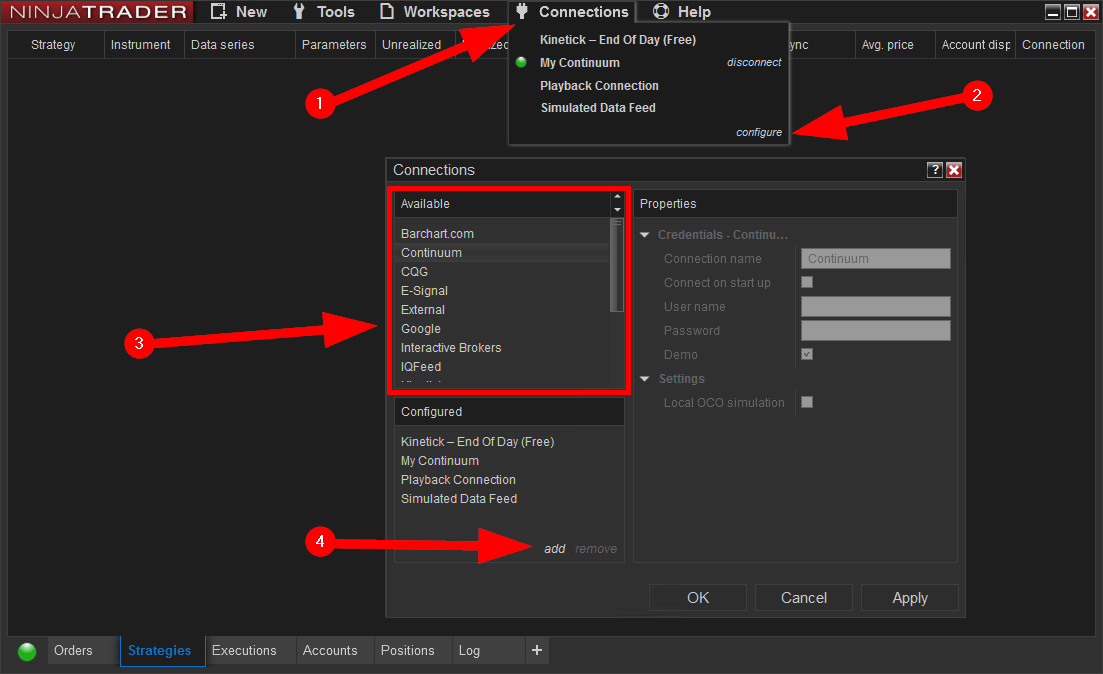
Next let’s add your data provider/broker connection so the platform can connect to the exchange and receive market data. if you haven’t signed up with on, you can review compatible brokers on this page http://ninjatraderecosystem.com/Brokers.php
Your broker will provide you the configuration details. For your reference, here is how the Ninja CQG provider connection is added: http://ninjatrader.com/ConnectionGuides/CQG-Connection-Guide
NinjaTrader offers FREE live futures data (not delayed) for SIM trading by signing up HERE. The connection expires after a few weeks, at which point you can renew again from the same page and using the same email address or fund a real account to use a permanent connection to the exchange.
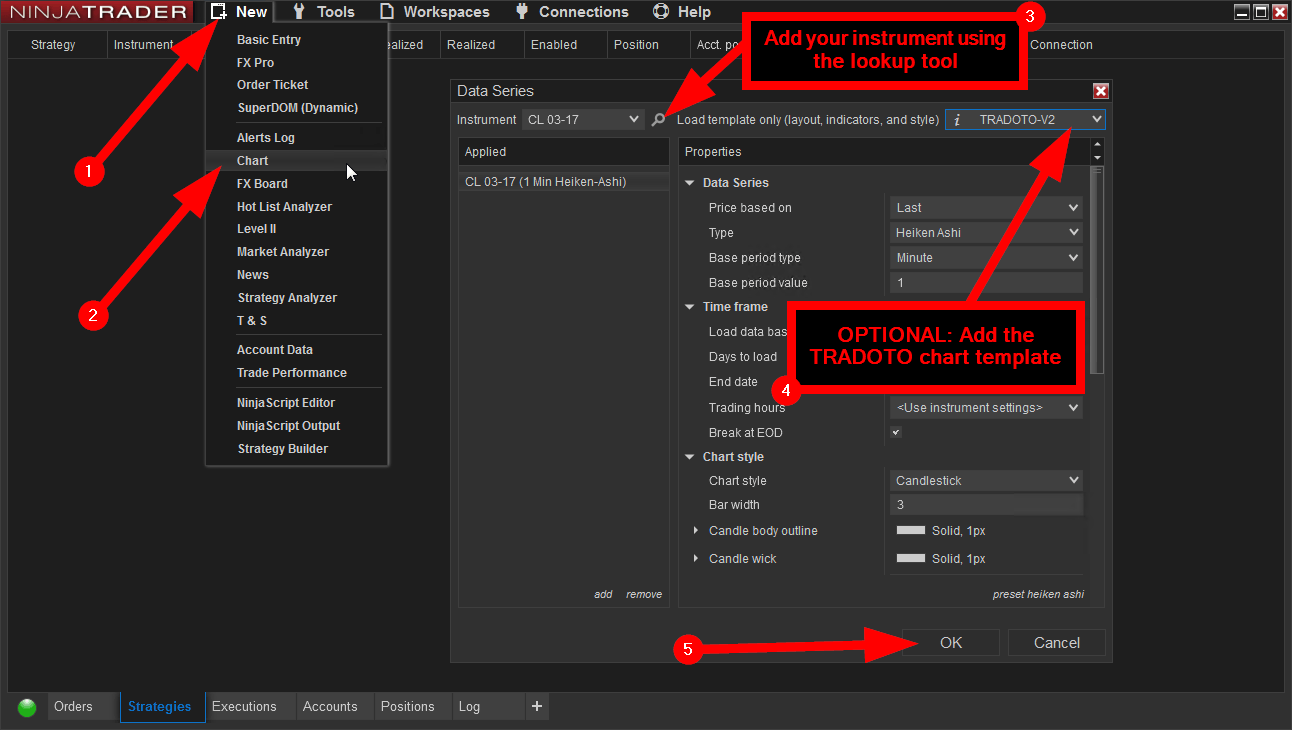
Setup your chart and instrument by following the steps below.
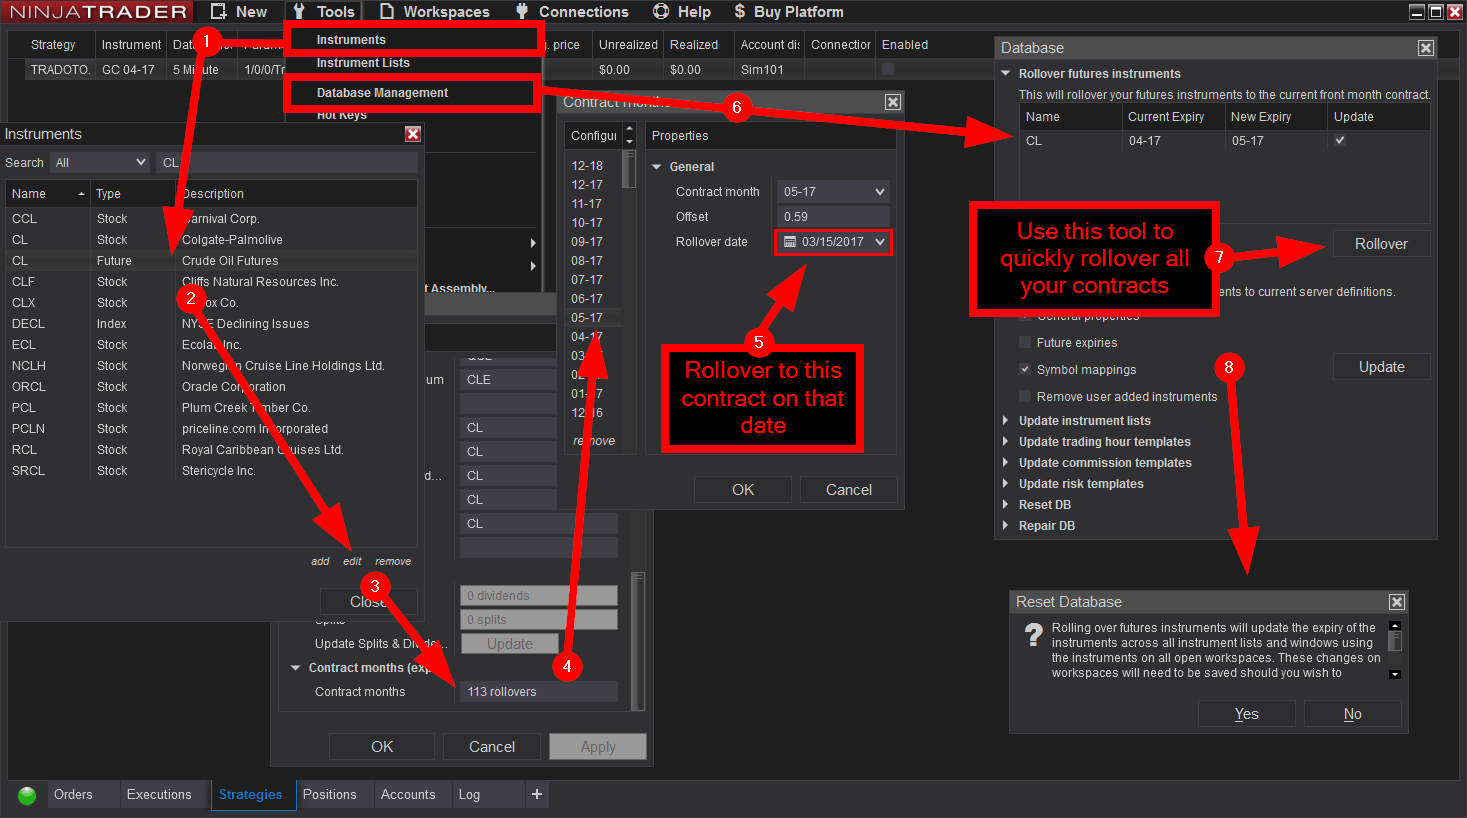
If you are trading futures, be sure to rollover your instruments on the expiration date. See 2nd picture below for more details on how this is done in NinjaTrader 8
TIP: to delete instrument from the instrument list after adding from the lookup tool, simply highlight it on the list and press DEL on your keyboard
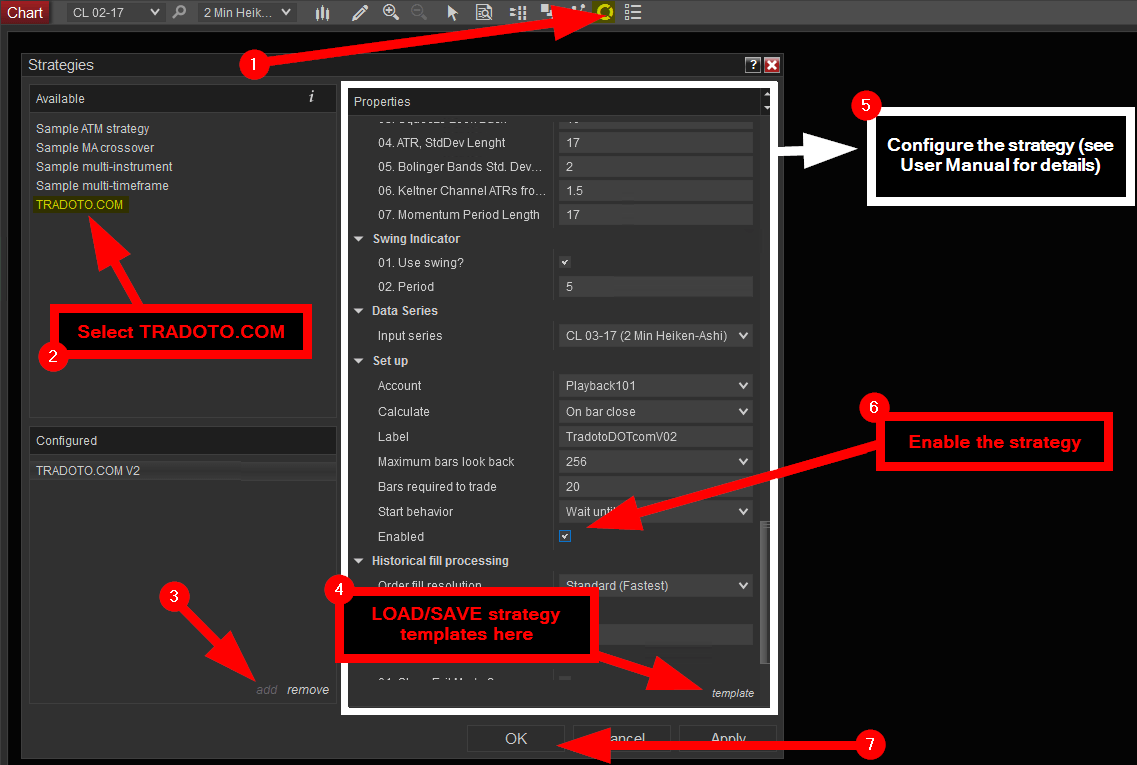
Once your machine ID has been submitted and registered, you can enable the strategy using two different approaches, both pictured below. Method 1 is done from the chart and method 2 from the control center strategy tab
Please note that with method 2 it will not display the closed pnl counter in lower left corner on the chart.
Pictured below is how the TRADOTO strategy is enabled on the chart, be sure to make changes to it or disabled it from the chart as well by disabling the strategy first and clicking APPLY. Mixing Method 1 and method 2 (shown below) could produce platform issues, always use the same method.
Please only enable one strategy per chart. Simply open a new chart window to trade additional instruments
Once your strategy has been enabled from the strategy tab as pictured below, be sure to make changes to it or disabled it from the strategy tab as well. Mixing Method 1 and 2 could result in some platform issues, always use the same method.
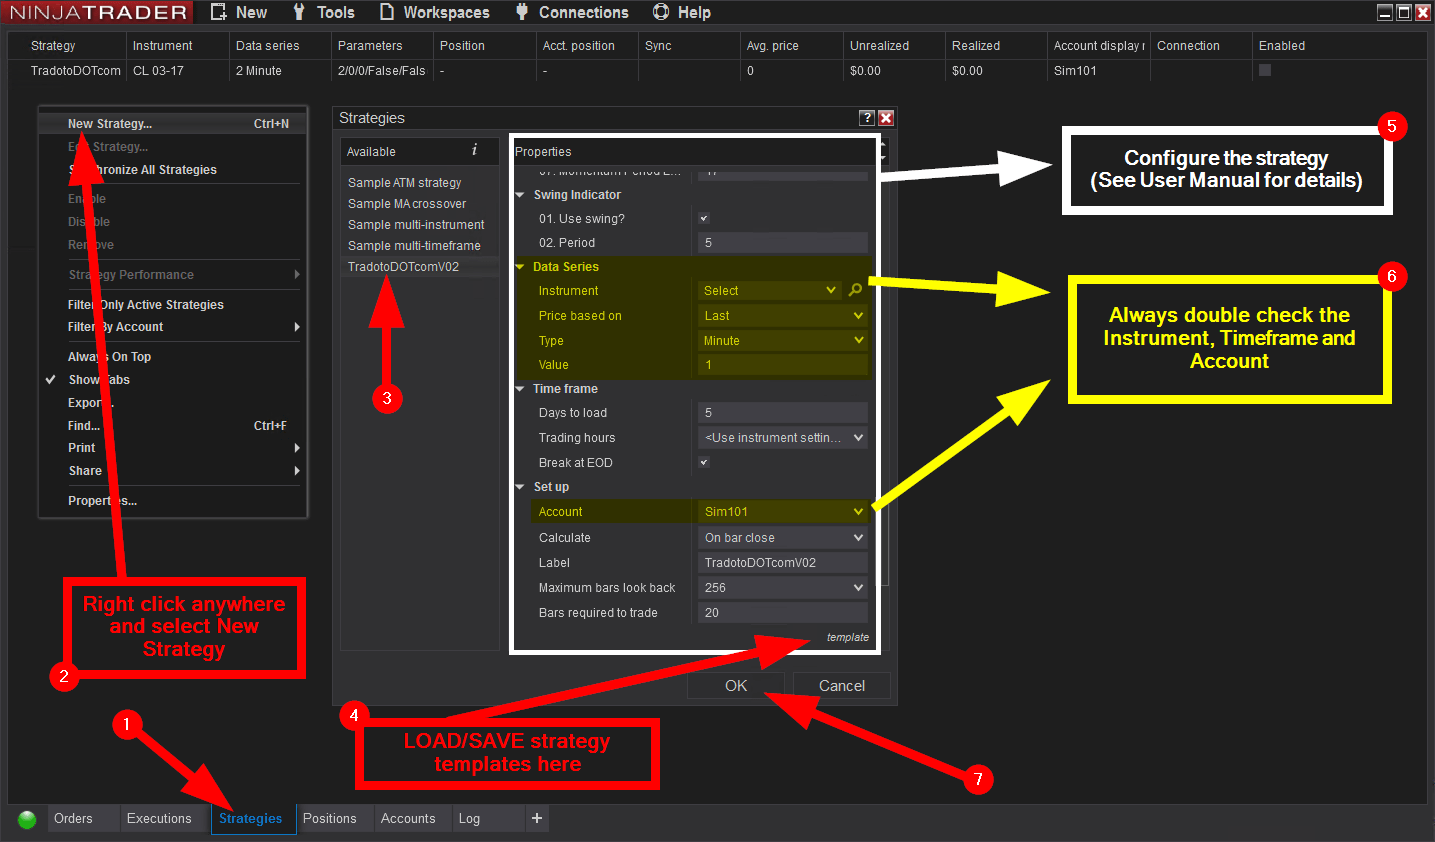
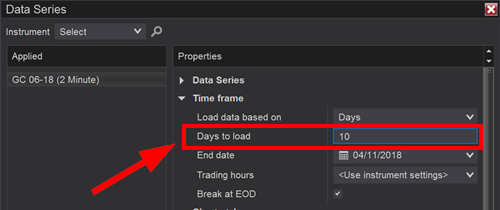
The best way to quickly assimilate what each input in our strategy does, is to setup a workspace with a monitor dedicated to the TRADOTO User Manual and the secondary monitor for your favorite chart instrument with a few days of historical data to play with. (you can increase the number of days loaded on the chart by right clicking on an empty spot on the chart > DATA SERIES > DAYS TO LOAD)
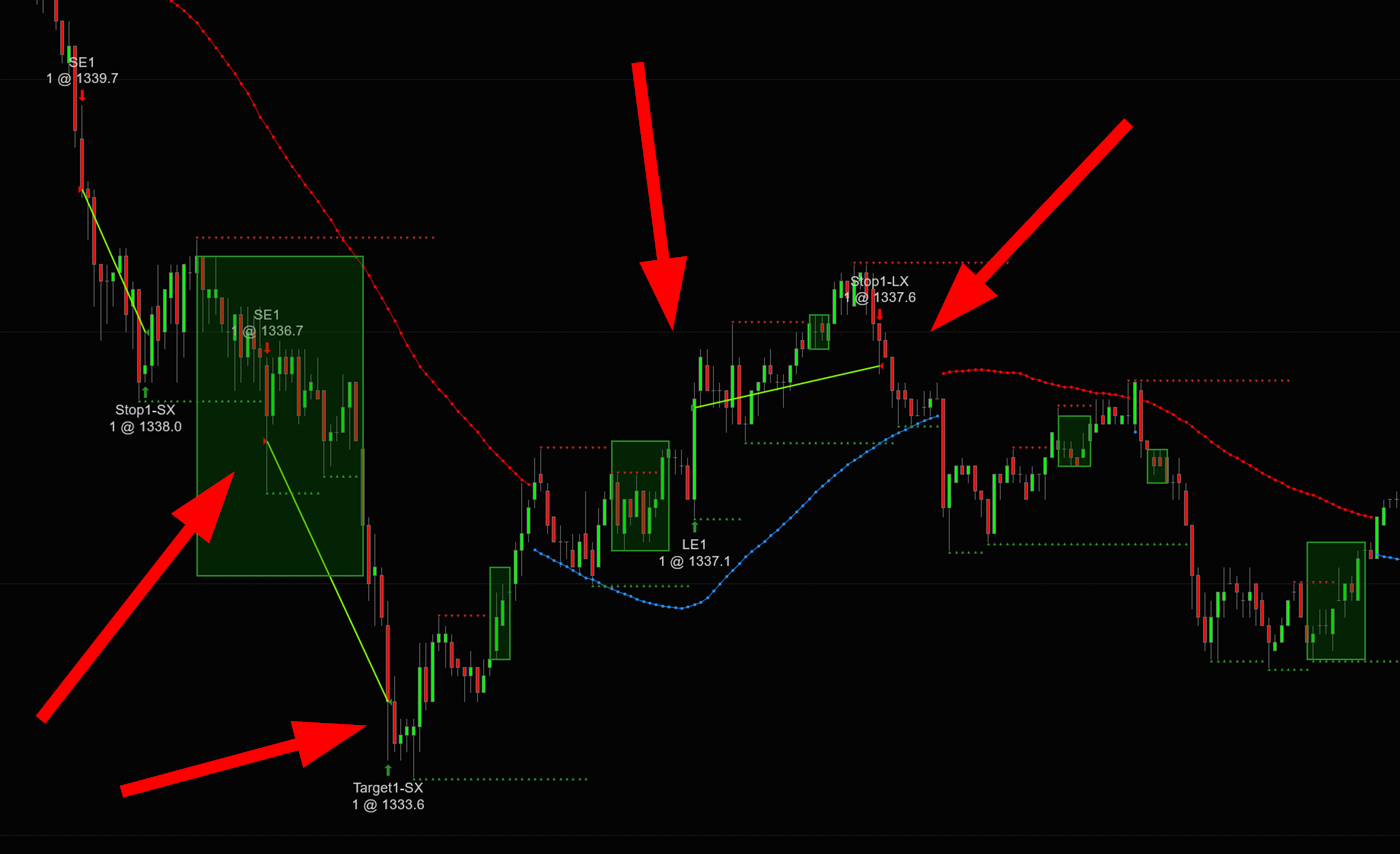
With this workspace, you’ll be able to quickly study each input and how they impact trading result by flipping the strategy ON/OFF after making minor adjustment. The changes you make will reflect instantly on the chart by showing you where the entry and exit would have been taken (as pictured below). A good exercise is to analyze the trade taken on the chart and improve them by slowly altering each inputs until the day is very profitable, this helps build a very strong understanding on how our strategy works. Be sure to practice with all TRADING MODE we offer so you can then focus your OPTIMIZATION phase with your favorite exclusively (more details on the this phase is found in the BACKTEST OPTIMIZATION tab after)
After playing with historical data, we advise taking it to the next level by running your configuration in REPLAY MARKET to see the trade enfold in REAL TIME, this is more time consuming but very eye-opening so be sure to spend time on that as well. You can learn more about MARKET REPLAY in the next tabs.
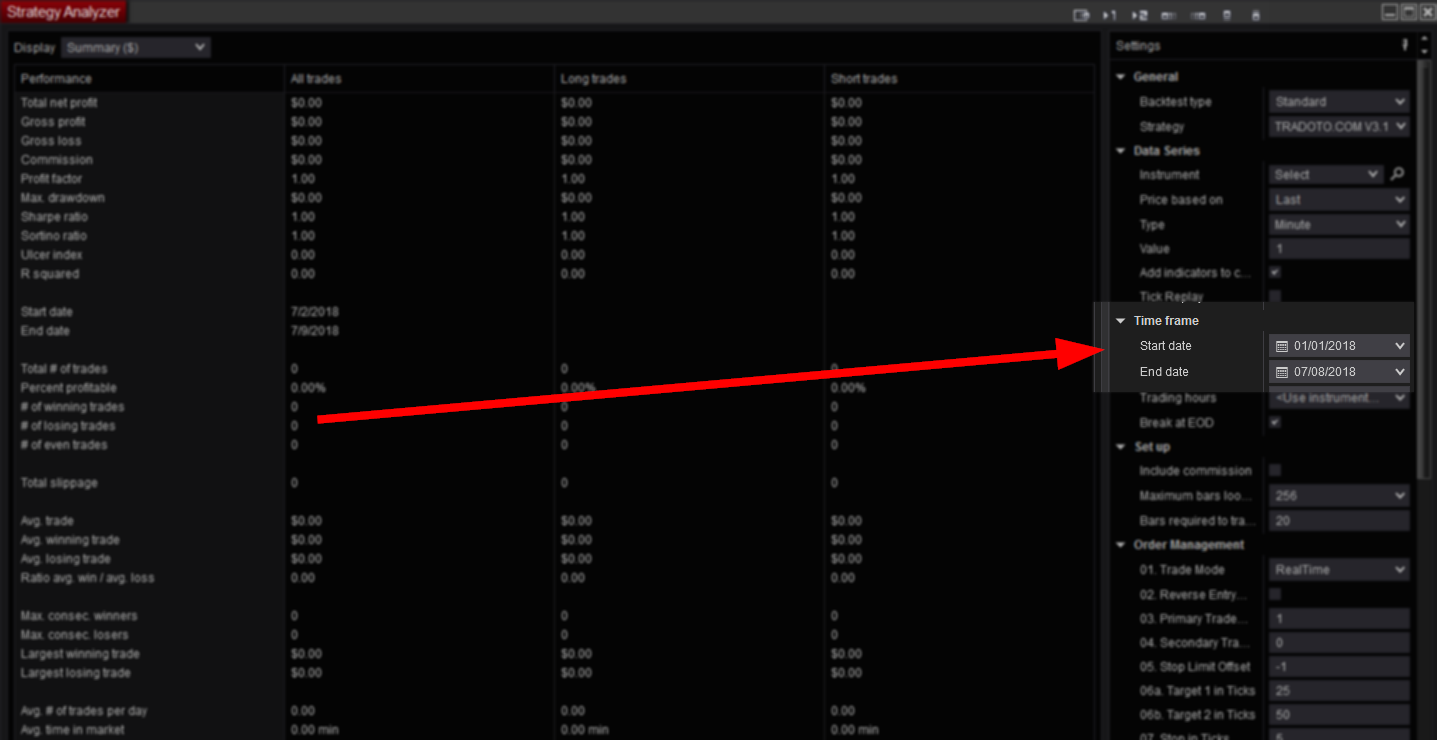
Before using our strategy on the LIVE market, it is required to find your optimal strategy configuration using BACKTEST.
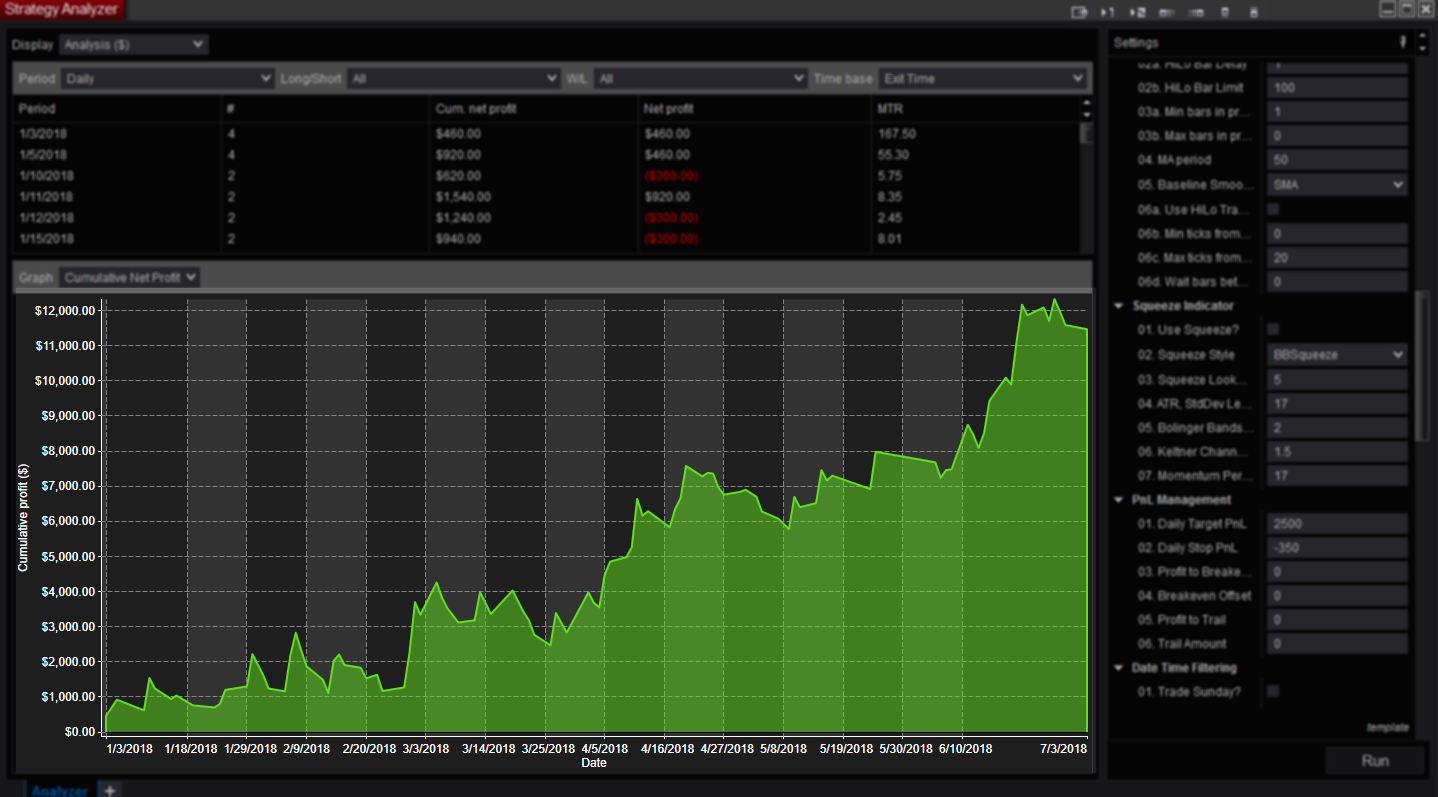
Optimizing your strategy means going over multiple weeks/months of market price action to see how a strategy configuration performs longer term. Before optimizing, be sure to fully understand all the strategy parameters covered in the user manual. Once this all make sense, you’ll want to start testing several configuration iterations using BACKTEST in the strategy analyzer window.
The first step to determine the validity of a trading idea is to backtest your configuration versus historical market data. Backtesting helps you identify quickly a potentially effective strategy configuration and serves as a starting point. Backtesting provides a bird’s eye view of how your strategy configuration may perform in a real-time trading environment. Testing various configurations and observing their results is an excellent way to get started and get different ideas brewing.
Backtest results generated with our strategy are accurately representating live trading trades, keep in mind that minor differences can be found from time to time as backtest works with 4 data points per candle (OHLC: Open/High/Low/Close) while real-time trading provides a tick by tick data feed which is way more detailed than backtest. For the closest profit representation, we recommend using the market replay mode, visit the market replay optimization tab for more details on this step. If you are seeing a lot of different result between your LIVE and BACKTEST trade, make sure that you are using the HIGH FILL RESOLUTION mode (not STANDARD) at the bottom of the tradoto control panel as this will ensure the NinjaTrader trading engine is provided with the most historical price action details, more details on this feature here.
In this two videos, we will go over how the strategy analyzer tool works and how backtest optimization is performed with our strategy. For more details on the Strategy Analyzer tool, you can consult the official NT manual as well.
For example, using 1 contract with a stop distance of 20 ticks or 2 contract with a stop of 10 ticks will cost you $200 per bad trade when trading Crude Oil which cost $10 per tick, in that case set your max daily loss to -400 to allow two bad trade in a row at least.
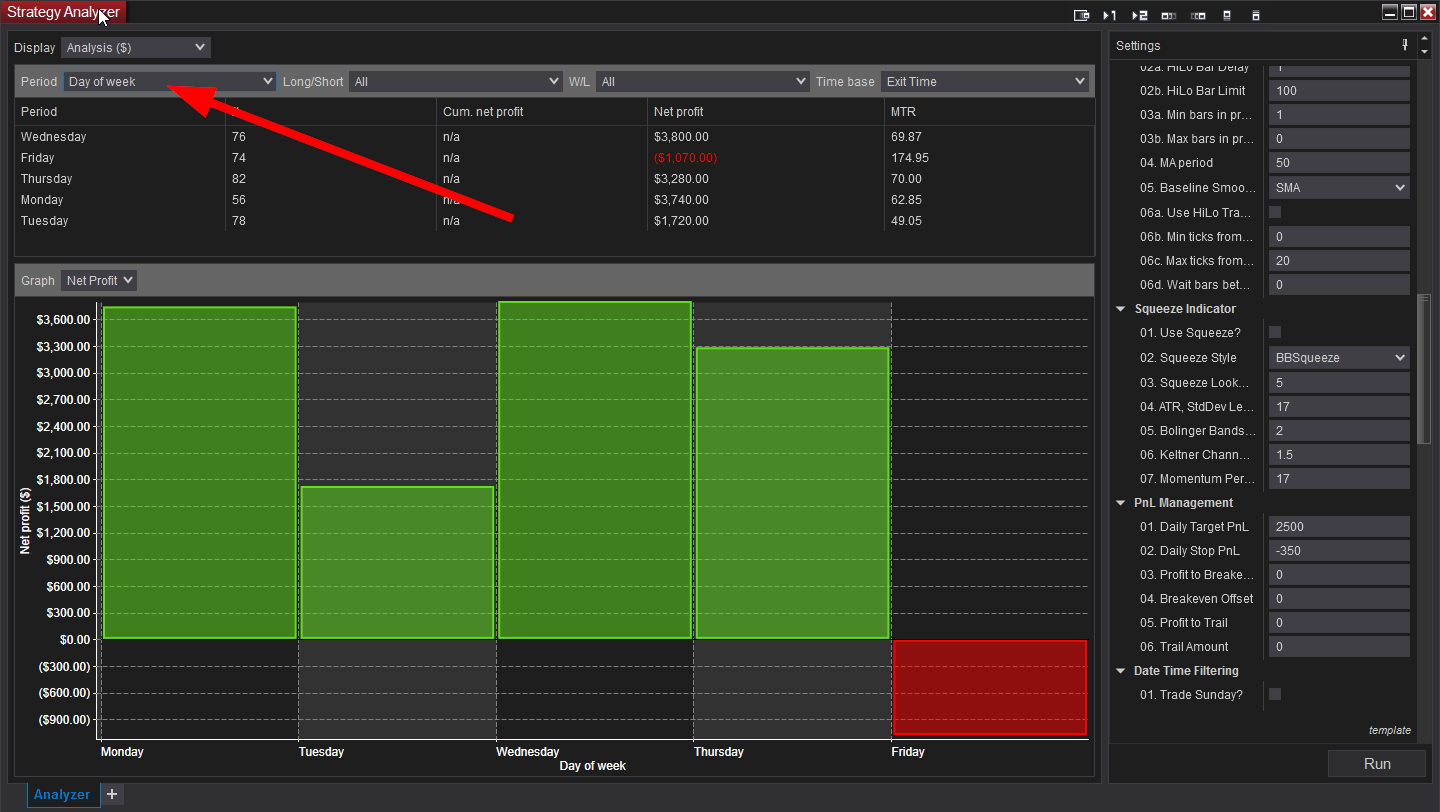
Once a profitable configuration is found through backtesting, expanding testing to MARKET REPLAY will help validate your results in a real time simulated environment.
Market Replay is the ability to replay market data it as if it was happening in real-time. You can trade in simulation against this data at varying levels of replay speed. This feature bring the most accuracy in strategy results, it is the best way to confirm that your strategy configuration (optimized in backtest) is working as expected.
The video below will walk you through how this feature works in NinjaTrader.
We strongly advise to setup text notification alerts on your phone to be alerted immediately when an error occurs on your platform, this is crucial to have when away from the computer!
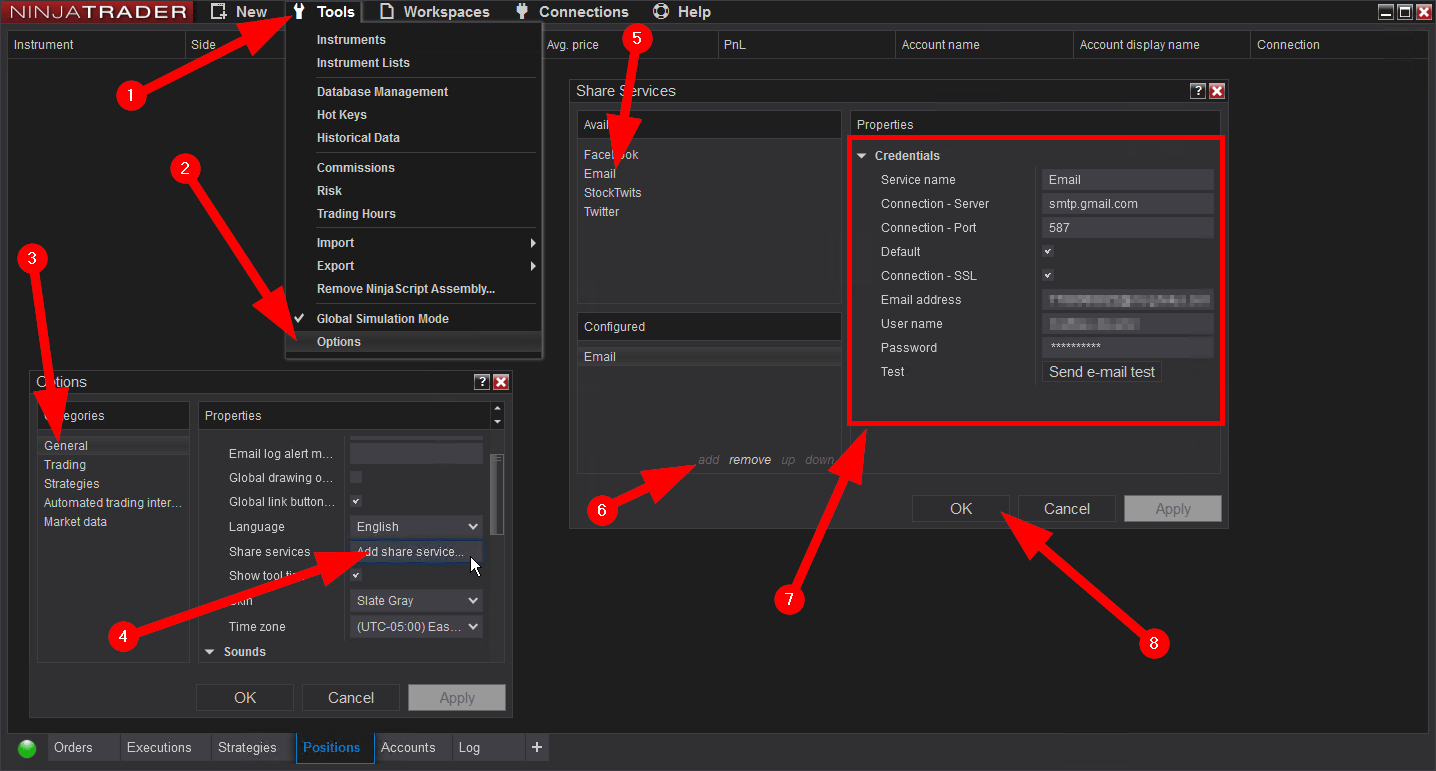
Below is a list of known e-mail provider settings demonstrating e-mail alerts configuration within NinjaTrader.
For step 7 pictured below, you’ll need to enter your personal email provider server settings, if your domain configuration isn’t listed under the picture, please research online what you should be using for your own email server.
Lastly in Step 7, the EMAIL ADDRESS field should be your phone carrier text messaging email address in order to receive alerts directly on your phone via SMS, if you unsure what it is, please research online or call your phone carrier to ask them (this should be the format: yourphonenumber@yourcarrierdomainname)
AOL:
Please note the user name may or may not contain “@aol.com”.
Server: smtp.aol.com
Port: 587
SSL: Enabled
User: “YourUserName” or “YourUserName@aol” Note: New accounts require “@aol.com” in username.
Password” “YourPassword”
GMAIL:
Please note the user name does NOT contain the “@gmail.com”.
Server: smtp.gmail.com
Port: 587
SSL: Enabled
User: “YourUserName”
Password” “YourPassword”
HOTMAIL:
Please note the user name contains the “@hotmail.com”.
Server: smtp.live.com
Port: 587
SSL: Enabled
User: “YourUserName@hotmail.com”
Password” “YourPassword”
YAHOO:
Please note the user name does NOT contain the “@yahoo.com”. Also you must enable ‘POP’ within your email account as shown HERE
Note: Yahoo may require a paid account for utilization of the SMTP/POP services.
Server: smtp.mail.yahoo.com
Port: 587
SSL: Enabled
User: “YourUserName”
Password “YourPassword”
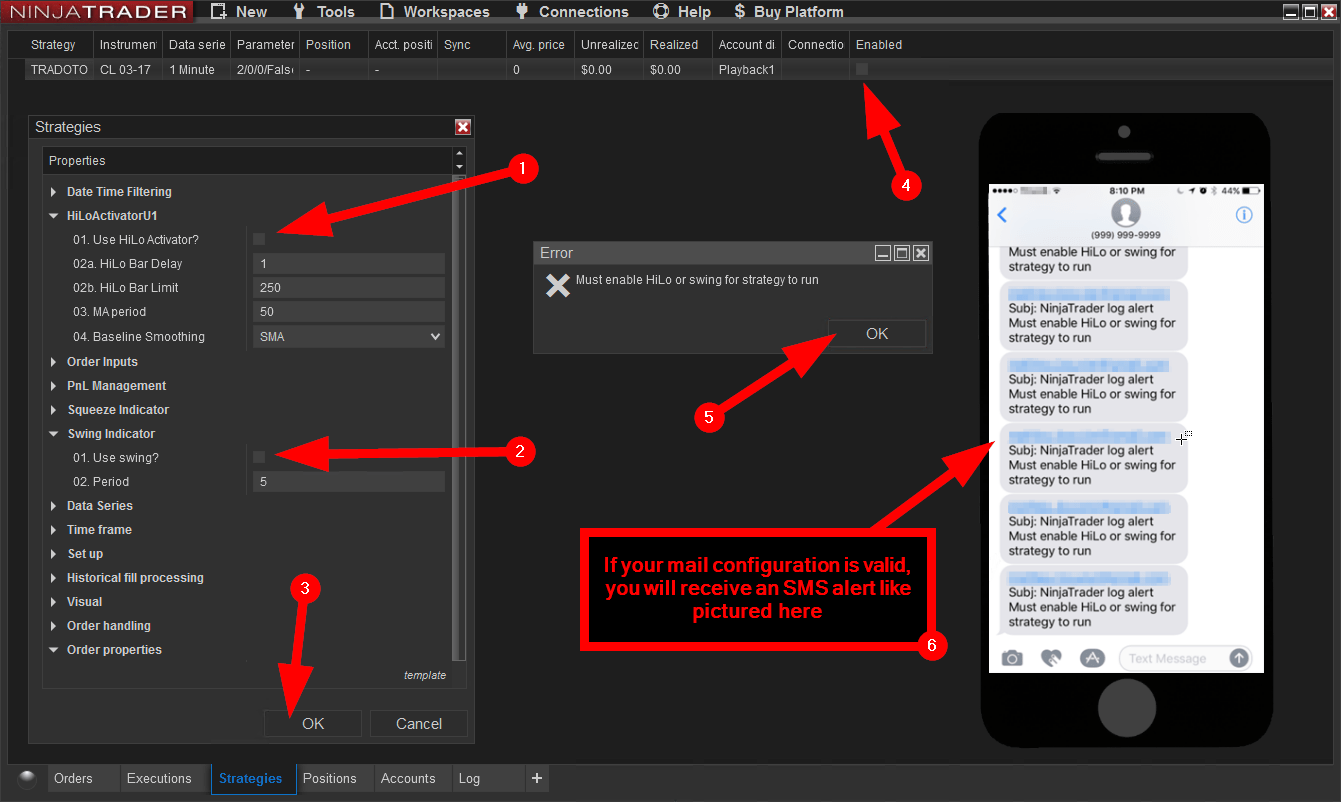
Once your mail setup is complete, please test your configuration as pictured below to ensure you are receiving SMS alert on your phone. Simply set the HiLo Activator and the SWING indicator to FALSE, then enable the strategy to trigger the error pictured, an SMS alert will be sent to your phone within the next 10 seconds.
Automated trading strategies leave pending orders on your broker servers waiting to be filled. When the internet connection goes down where the strategy is running, the pending order is left running on the broker side unattended, this means that if the price action hit that order, the platform running the strategy won’t be online to submit the usual stop and limit orders to manage the active trade.
For this reason, you must be aware when the internet goes down so you can promptly cancel any pending order left on the broker end and reconnect your strategy when the internet is back up
There are many websites that offer monitoring services, to start monitoring your home internet connection, you must ensure you have a STATIC IP address, then you can enable monitoring using a site like this one http://uptimerobot.com/ (to receive SMS alert instead of email, simply set the primary email to the same email address used in the MOBILE SMS TEXT NOTIFICATION tab above, that email will relay new emails to your phone number directly)
Another option is to setup your platform on a trading Virtual Private Server (aka VPS). Those dedicated server are hosted offsite close to the exchange for faster fill and will have a static IP address. You can then use their server static IP address with your monitoring site. Here is NinjaTrader recommended VPS provider http://www.ninjatraderbrokerage.com/hosting_services
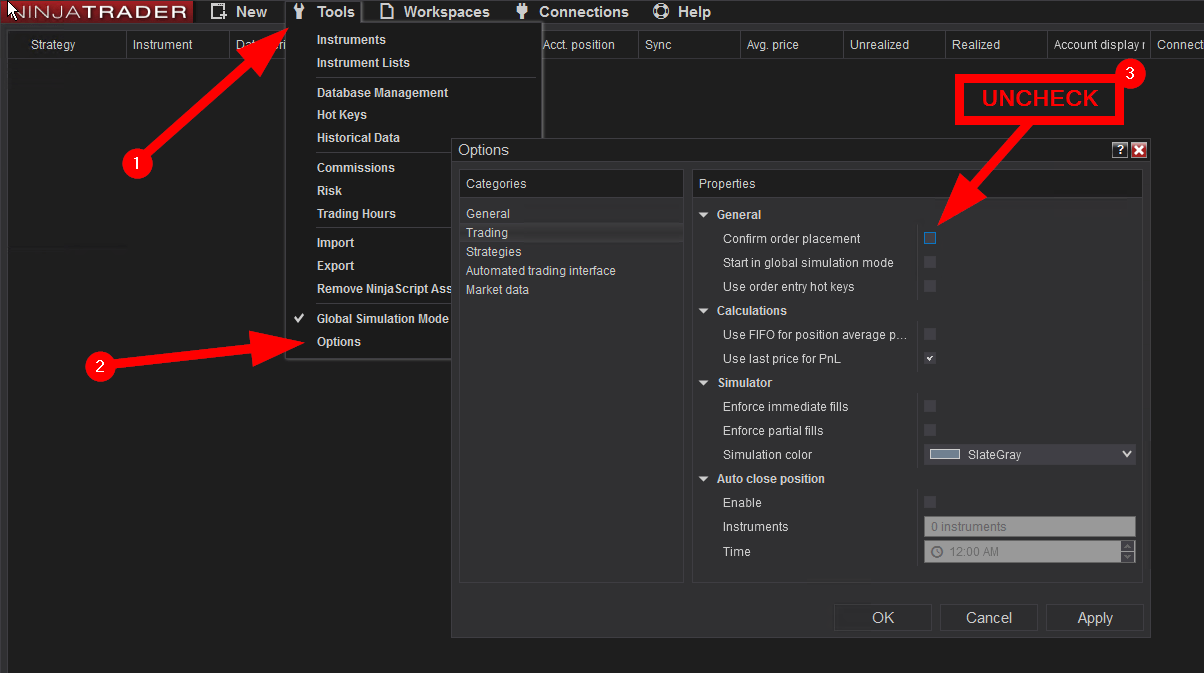
To ensure the strategy can cancel all pending and active orders In case your platform loses internet access, we need to advise the NinjaTrader 8 platform to leave the strategy running when the platform loses and restore internet access. Please follow the step below to do so:
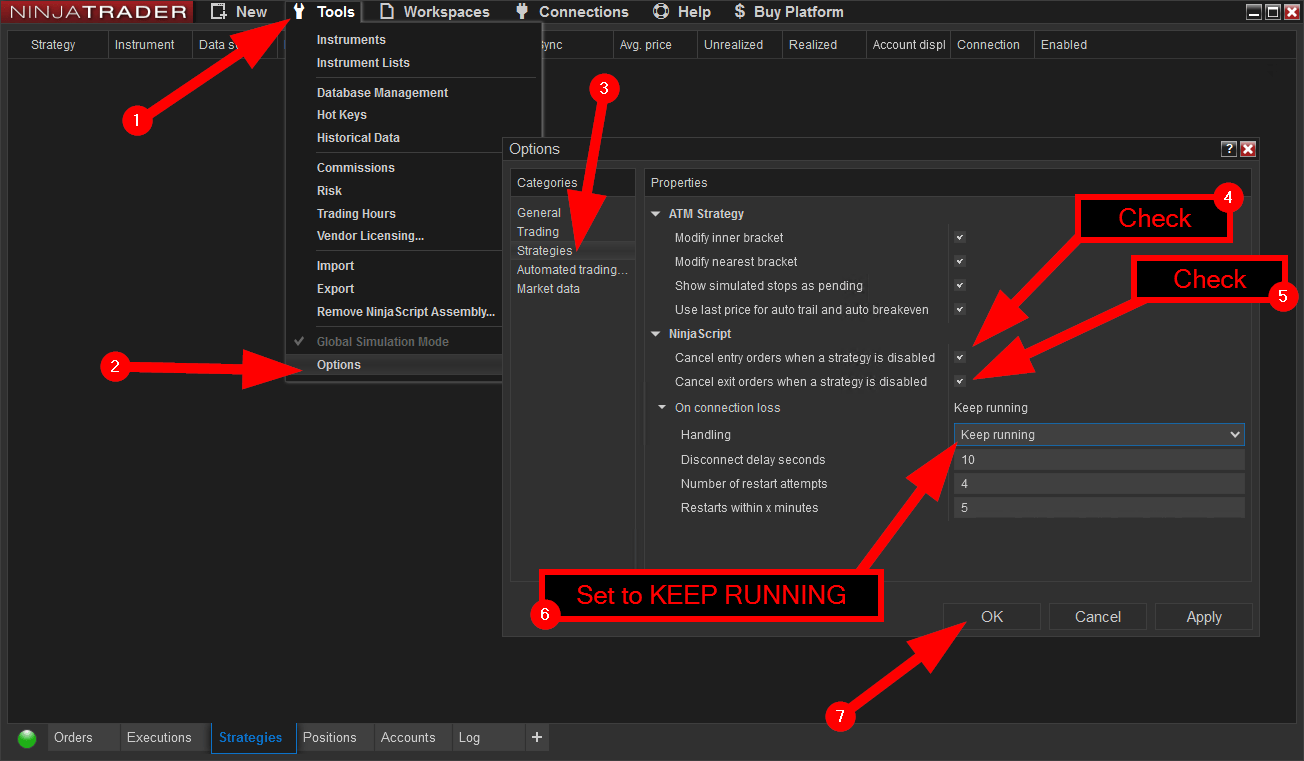
Also we recommend to Uncheck the “confirm order placement” option as pictured below to avoid the repetitive warning pop up every time the strategy is turned on:
Most markets become highly volatile when important news event surface. It is highly recommended that you anticipate when those events occur to either turn off the strategy in order to avoid slippage or customize it to maximize profits and safety.
Here is a list of popular economic calendar sites, some even offer mobile application to receive alerts on your smart phone (filter the importance of the news to only show medium and high events and focus only on the instrument you are trading of course).
By default, your computer will go into sleep mode after a period of inactivity. in order for TradOTO to run 24/7 your computer must remain powered on all the time, watch this video to learn how this is done on a Windows 10 computer:
After a few months of LIVE trading with great results, we recommend migrating your platform in the cloud for greater reliability/uptime and reduce your slippage with a server located closer to the exchange.
This cloud hosted server solution also lets you easily remote access your TRADOTO platform from anywhere, even your phone.
We advise to setup your VPS with the Windows Server 2012 operating system (version 2019 will require more ressources to run at similar speed), at least 3GB RAM and a CPU with 2 cores. Our recommended VPS provider is VPSSERVER which offers those hardware specifications for as low as $29.99/m, you can sign up for a 7 day free trial using the button below.
 This User Manual covers everything there is to know about the TRADOTO strategy
Choose the trading mode that best suits you then start optimizing your instrument with it. To quickly understand the mechanism behind those trading mode, be sure to try them from a chart in Market Replay to see them work in REAL-TIME and historical backtest mode as well to instantly see how the strategy would have traded in the past.
– The Trading Mode tab let you activate one of many fully automated trading mode we offer
– The order entry/exit management tabs tells the strategy HOW to trade
– The Swing / Hilo / Ichimoku / Pivots / Squeeze tabs go over TRADOTO core indicators that tells the strategy WHAT to look – for when placing trades.
– The PnL Management tab below tells our strategy when to stop trading during the day when a specific profit or loss is reached.
– The Date Time Filtering tab below tells our strategy WHEN to start and stop trading each day of the week.
The most effective way to study our strategy is having the user manual page on your secondary monitor and opening a chart of your favorite instrument on the primary monitor, with this workspace you’ll be able to put in practice how each input affect trading performance on the chart, simply switch the strategy ON/OFF using the BACKTEST trade execution mode to have trades instantly drawn on the chart.
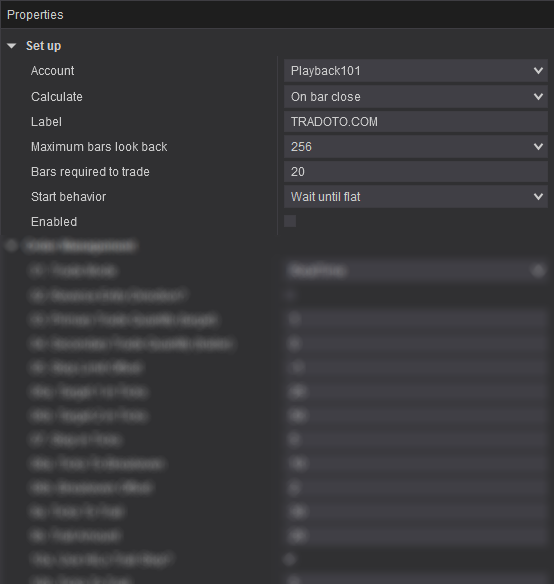
Account
Sets the account for which the strategy will trade against, make sure this match your active connection, Sim, Replay or Live
Calculate
Dictate when the indicators values are calculated, either on bar close, on each tick or on price change. Please leave default with ON BAR CLOSE if you haven’t used other settings in the past.
Label
leave default
Maximum bars look back
Max number of bars used for calculating indicator/internal series values. 256 setting is the most memory friendly.
Min. bars required
Set the minimum bars required for the strategy to calculate, We recommend leaving this default at 20
Start behavior
Leave default with WAIT UNTIL FLAT is recommended, learn more about each option here
Enable
Turn the strategy ON and OFF
This section lets you specify the trading mode to use.
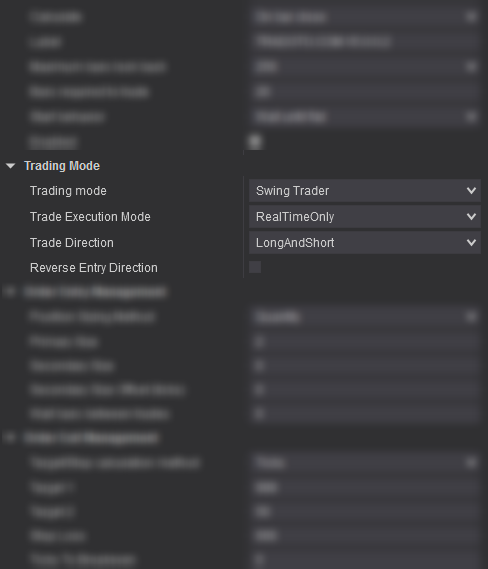
Trading Mode
Select the trading mode you would like to automate your trade with. For a definition of each mode, please refer to their dedicated tabs in the user manual
Trade Execution Mode
This input let’s you switch between different strategy execution mode.
1 – Backtest execution mode is used for optimizing the strategy from the Strategy Analyzer window or generating trades on historical data from the chart window.
2 – Realtime execution mode is used when trading in real-time with SIM or LIVE data and also when using Market Replay.
3 – You can also use the two execution modes at the same time by selecting BacktestAndRealTime from the dropdown menu
Trade Direction
This input allows you to only trade in one direction, short or long. This can be helpful in some markets where you see that the daily chart is extremely bearish or bullish.
Leave it set to LongAndShort to trade in any direction.
Reverse Entry Direction?
When True, entry direction will be reversed for all trades (LONG instead of SHORT and SHORT instead of LONG). Very useful during choppy market times.
This section lets you configure how the strategy handles trade entries.
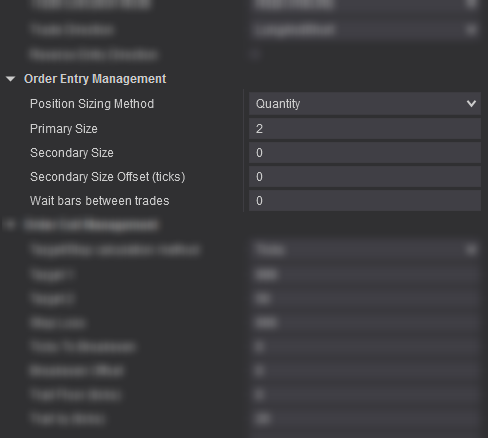
Position Sizing Method
You can either manually set your position sizing by using the QUANTITY method or have it set dynamically by using the CAPITAL TO RISK method by telling the strategy how much capital you wish to risk on your primary and secondary positions.
Primary Size
Set your primary trade size (quantity or capital to risk depending on position sizing method used above).
Secondary Size
Set your secondary trade size (quantity or capital to risk) to use for the Target 2 input specified below.. Set to 0 if you only wish to use fixed target 1.
Secondary Size Offset (ticks) [New in v5]
To trade your secondary size after a pullback, type a negative entry offset value. Or use a positive value to wait for continuation. Set to 0 to trade with Primary only.
Wait bars between trades
The strategy will wait this many bars after a trade is closed before entering a new one. This helps avoid over-trading in some trading modes and market conditions.
This section lets you configure how the strategy handles trade exits.
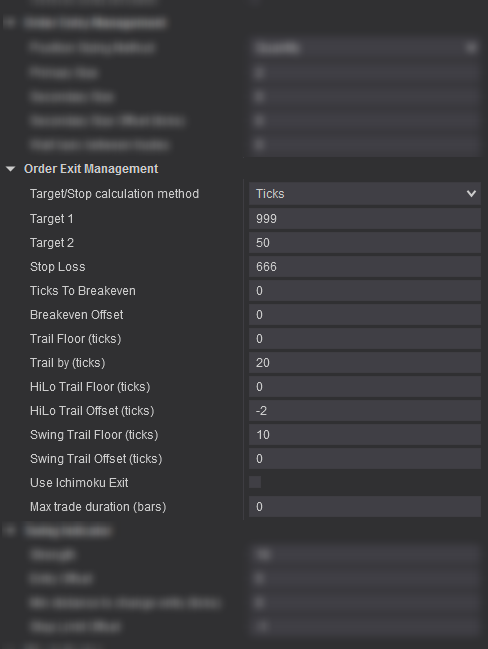
Target/Stop calculation method
You can decide to set your target 1/2 and stop with the TICK calculation method or PERCENTAGE. Tick is commonly used in Futures while Percentage mostly with Forex and Stock but you are welcomed to use any method you like on any markets.
Target 1
Set how many ticks/percentage away should the target be for Target 1
Target 2
Set how many ticks/percentage away should the target be for Target 2
Stop Loss
Set how many ticks/percentage away should the stop loss be for Target 1 and 2
Ticks to Breakeven
Tells the strategy to move the stop to breakeven after this many ticks. Set to 0 to disable.
Breakeven Offset
When the stop is moved to breakeven, tells the strategy to offset it by this many ticks. A positive value will place the stop in profit
Trail Floor (ticks)
After this many ticks in profit, the strategy will start trailing the stop order. Set to 0 to disable.
Trail By (ticks)
Once trailing is enabled, the strategy will trail the stop by this many ticks below the market price.
HiLo Trail Floor (ticks)
After this many ticks in profit, the strategy will start trailing the stop based on the HiLo indicator trendline. Set to 0 to disable.
This will let the strategy use the HiLo Indicator trendline to trail the stop order (if the parameter “Reverse Entry Direction” in the TRADING MODE section is enabled, then this parameter will be forced to FALSE as reversing entries makes HiLo trailing irrelevant). You can learn more about the HiLo indicator in the user manual HiLo indicator tab.
HiLo Trail Offset (ticks)
Used to define a positive or negative offset for trailing based on HiLo Indicator trendline.
For example, if set to -10, the stop will follow 10 ticks above the HiLo trendline in a bullish trend or 10 ticks below in a bearish trend. Try it out in market replay to see it play out in real-time.
SWING Trail floor (ticks) [New in v5]
After this many ticks in profit, the strategy will start trailing the stop based on the last plotted SWING . Set to 0 to disable.
SWING Trail Offset (ticks) [New in v5]
Define a positive or negate offset to trail the SWING indicator.
Use Ichimoku Exit
When true, the strategy will close active trades as soon as the Tenkan and Kijun crosses each other, from under or above (you can learn more about the ichimoku indicator in the user manual ichimoku tab)
Max trade duration [New in v5]
Specify the max trade duration allowed in bars. Set to 0 to disable.
The Swing indicator plots horizontal lines that represent the high and low swing points based on the “Strength” input value specified. In other words, this indicator represents potential support & resistance areas.
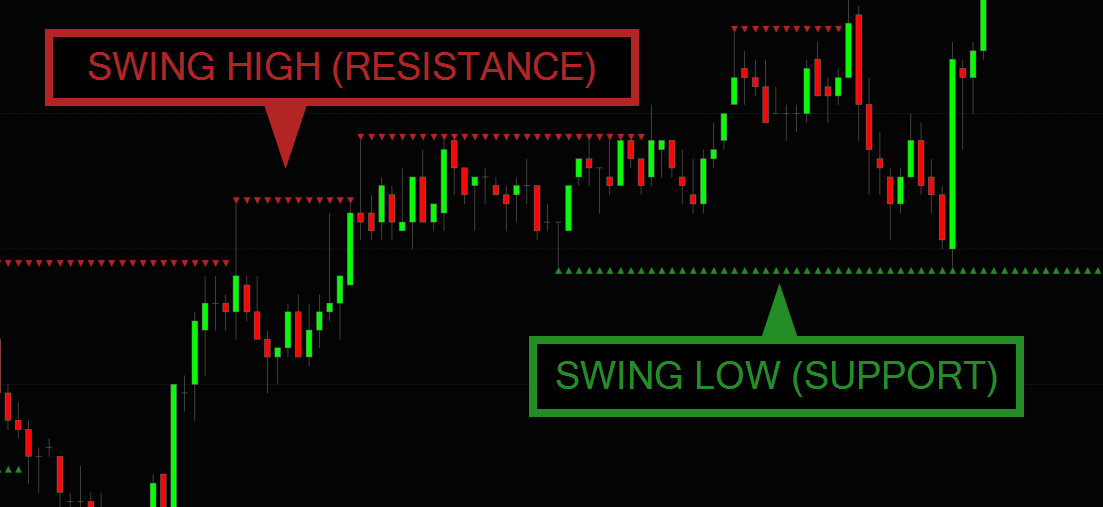
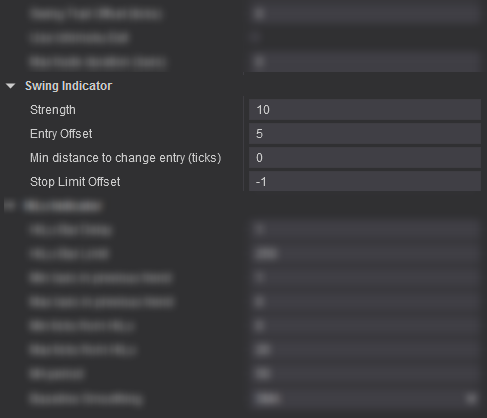 Strength
Indicate how many bars are required to constitute a Swing point. Use a small number to increase the pivot plotting frequency and use bigger number to only plot the major support and resistance levels.
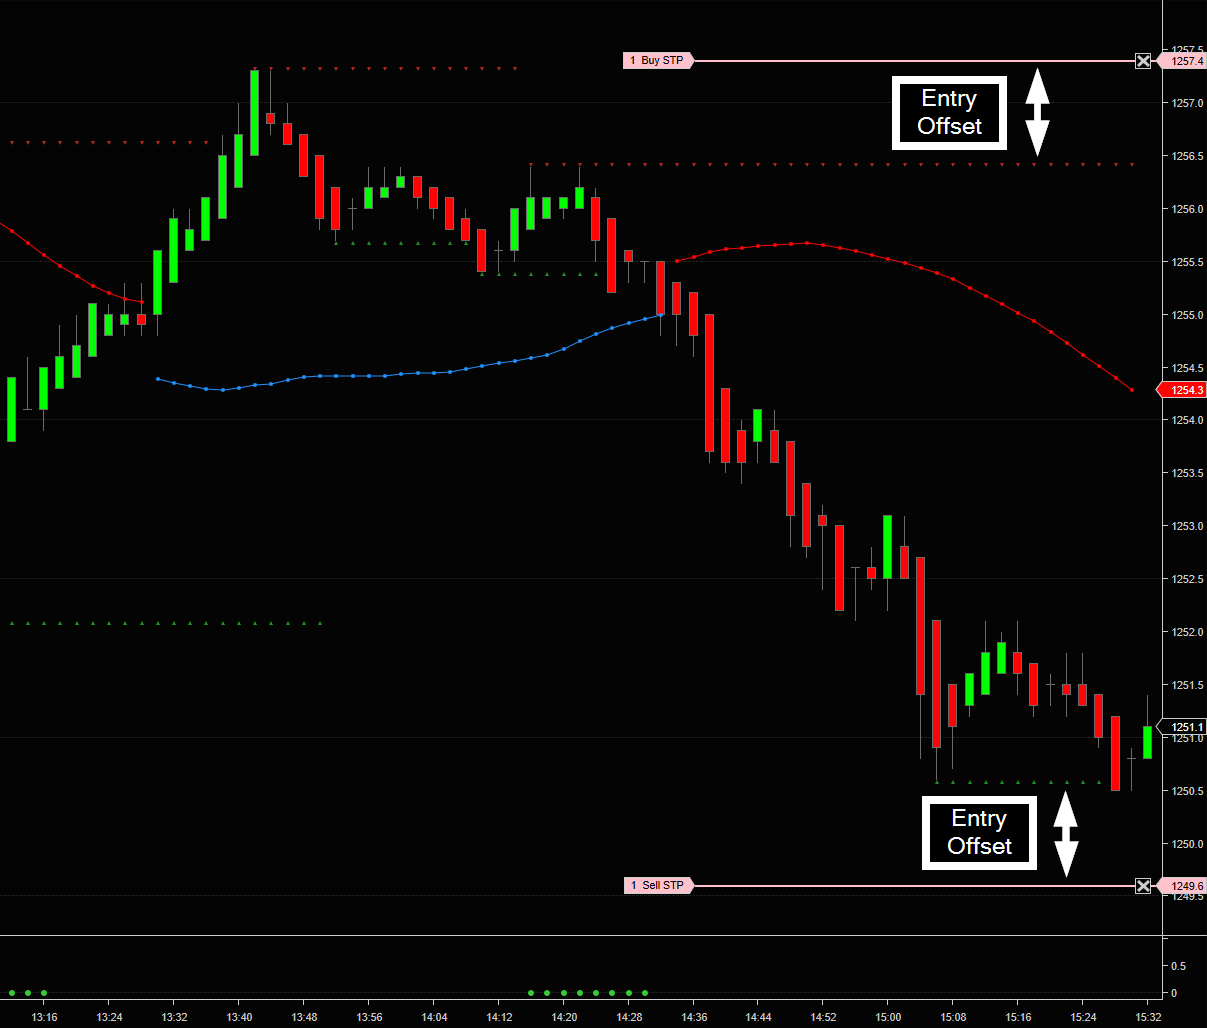
Entry Offset
How many tick(s) above or below the last SWING the strategy will enter LONG or SHORT (a negative value can be used as well to enter trade before a support or resistance level is broken)
Min distance to change entry (ticks) [New in v5]
Minimum distance in ticks required between the current and newly plotted swing for the stop entry entry order to adjust itself. This input help you ignore newly plotted swings that are too close to the last one, thus keeping your stop at the major swing locations only.
Stop Limit Offset
Set to -1 to have the strategy use a Stop MARKET entry when the trade is triggered or use 0 or larger for a stop LIMIT entry. We recommend using a stop market entry to ensure the order is filled
SWING TRADER – 100% AUTOMATED TRADING MODE
The TRADOTO strategy leverages the Swing indicator as a fully automated trading mode by enabling the Use Swing Trader input.
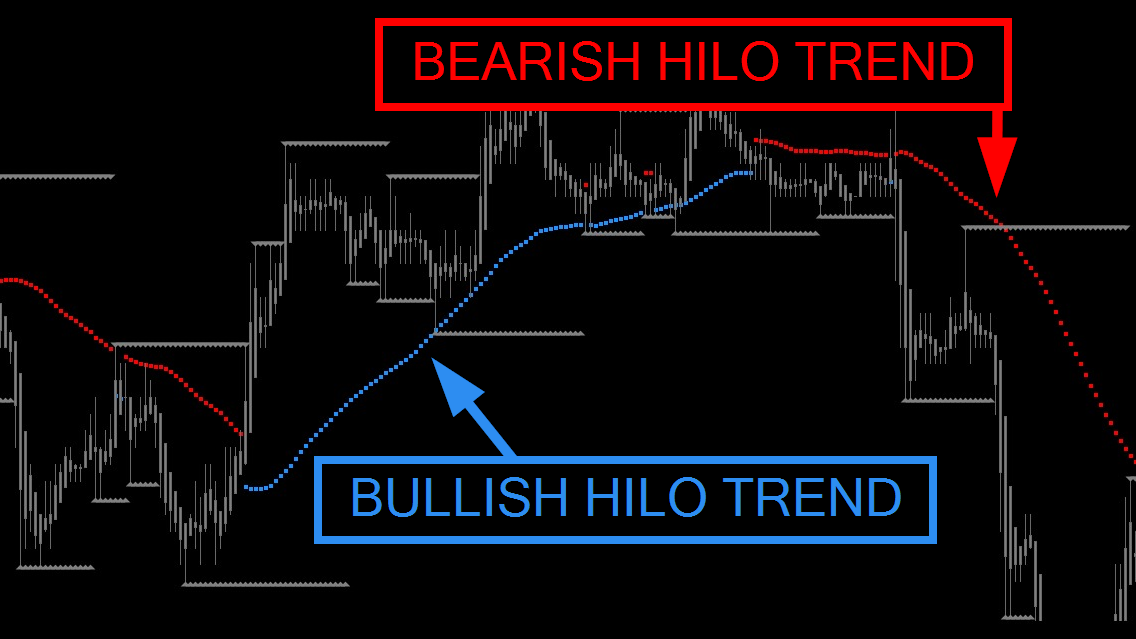
The HiLo Indicator is a trend-following technical indicator used to reflect the market’s direction of movement and generate trend-following entry signals. The HiLo Indicator is a simple moving average of the previous three periods’ highs or lows, based on the moving averages logic.
The HiLo indicator appears in two different colors on the chart:
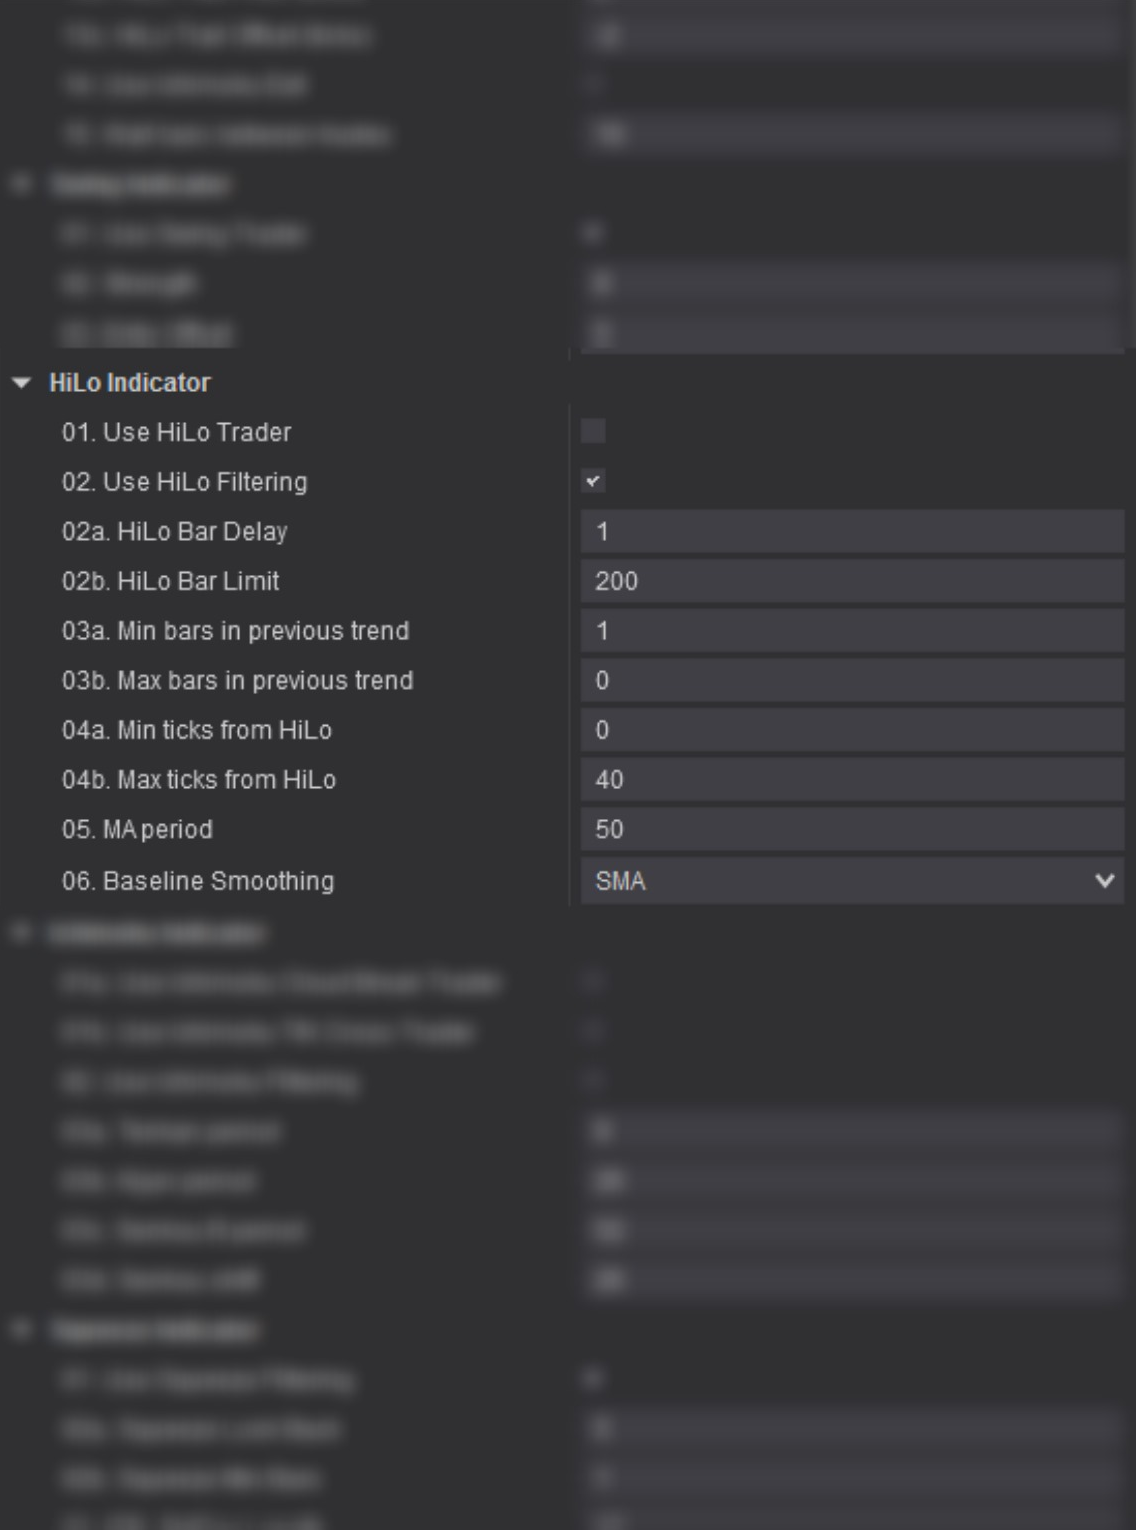
01. Use HiLo Trader
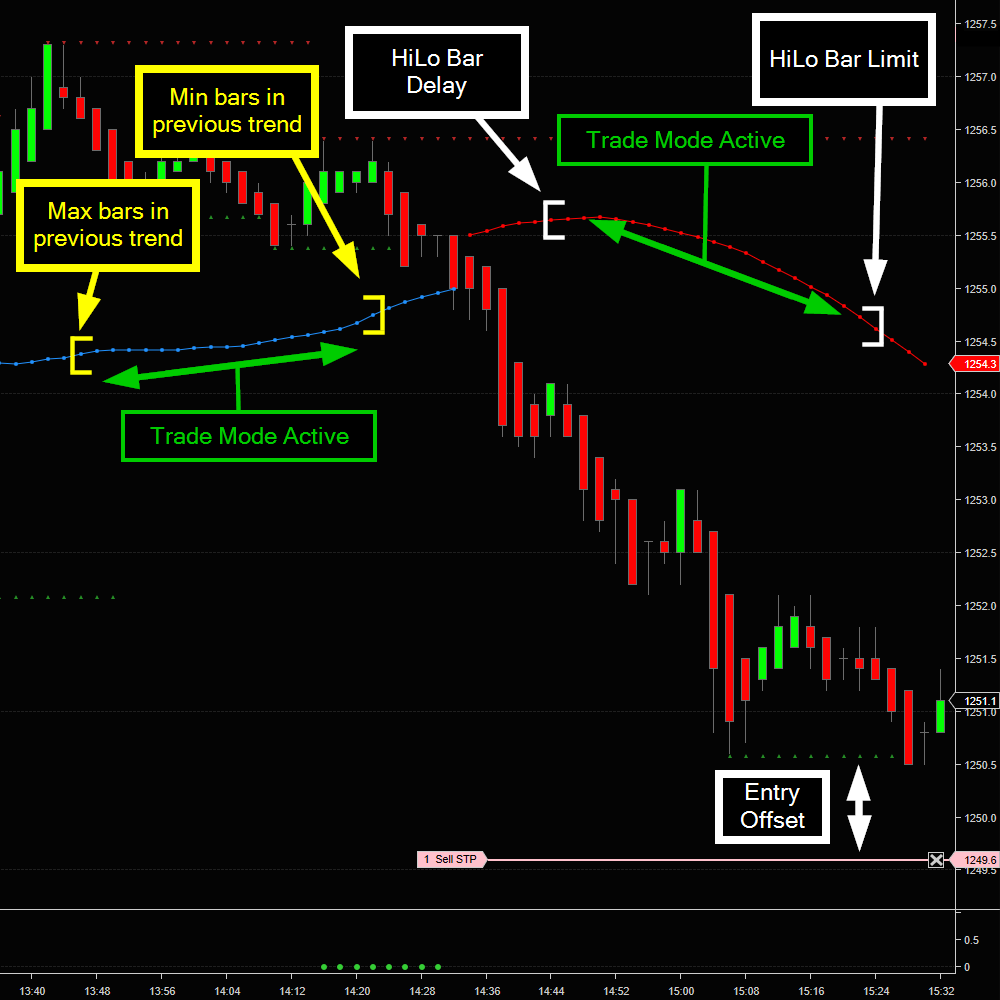
When ENABLED, the strategy will submit a market order as soon as the price enters the valid price range define using the inputs below. Please consult the Trading Mode section for more details.
02. Use HiLo Filtering?
When ENABLED, the strategy will use the HiLo indicator to filter trades by always trading in the direction of the trend and by respecting the inputs specified below. This lets you define precisely in which condition the strategy is allowed to take trades.
02a. HiLo Bar Delay
Set how many HiLo bars are required from the start of each new HiLo trend before the strategy is activated (minimum 1)
02b. HiLo Bar Limit
Set how many HiLo bars are required from the start of each new HiLo trend before the strategy is deactivated
03a. Min bars in previous trend
Set the minimum # of bars required in the previous HiLo trend to to keep the strategy activated in the current HiLo trend (useful to avoid choppy market)
03b. Max bars in previous trend
Set the maximum # of bars required in the previous HiLo trend to to keep the strategy activated in the current HiLo trend.
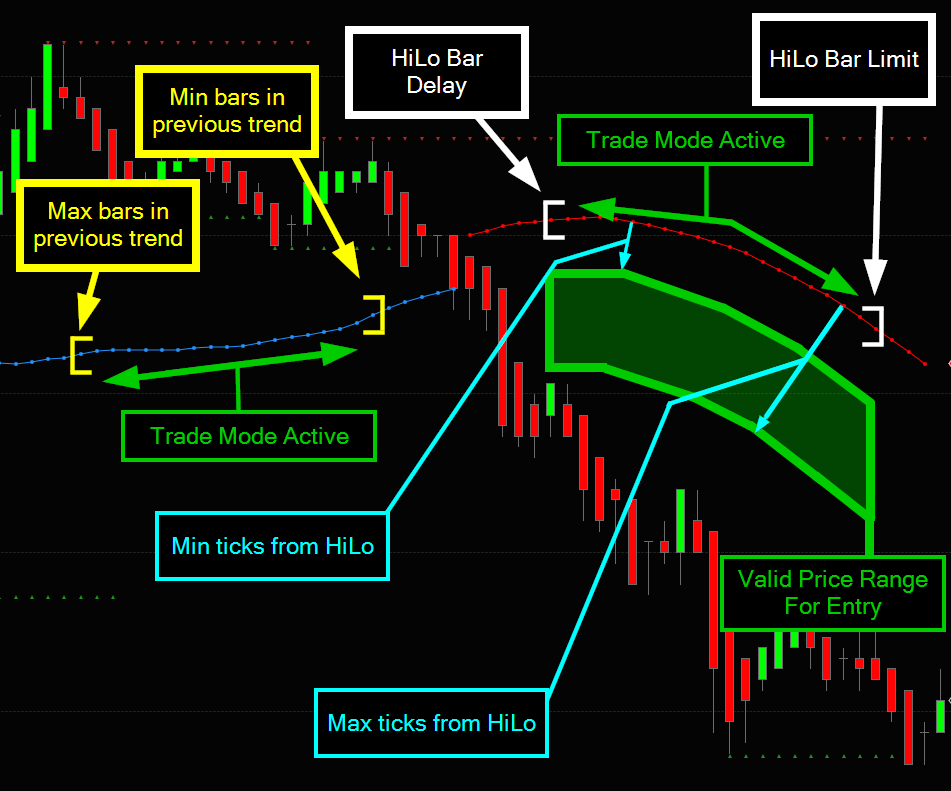
04a. Min ticks from HiLo
[New in v4 – Applies to HiLo Trader and HiLo Filtering]
Set how close to the HiLo you want the strategy to take trades. For example with a value of 5, you would be telling TRADOTO to not take any trade when the price is within 5 ticks of the HiLo trendline.
04b. Max ticks from HiLo
[New in v4 – Applies to HiLo Trader and HiLo Filtering]
Set how far to the HiLo you want the strategy to take trades. For example with a value of 30, you would be telling TRADOTO to not take any trade when the price is 30 ticks or more away from the HiLo trendline.
05. MA period
Used to alter the Moving Average period, default is 50.
06. Baseline Smoothing
Used to alter the Moving Average type for baseline, default is SMA (Simple Moving Average)
HILO TRADER – 100% AUTOMATED TRADING MODE
When the Use HiLo Trader input is checked, the strategy will let you trade fully automated within a price range zone plotted once per HiLo trend. TRADOTO will place a market order as soon as the bar closes within the valid price range zone pictured in green.
The valid price range is specified with Min and Max ticks from HiLo and HiLo Bar delay and Limit inputs and only when the previous HiLo trend-line had more or less bars than specified in the Min and Max bars in previous trend inputs.
GLOBAL TRADING FILTER
When the Use HiLo Filtering input is checked, the HiLo trading logic will filter all active trading modes.
The following logic will be enforced (see picture above for visual clarification):
ORDER STOP LOSS TRAILER
When the “Use HiLo Trail Stop” input is checked (located in the ORDER MANAGEMENT section), the strategy will trail the stop loss based on where the HiLo trendline is located.
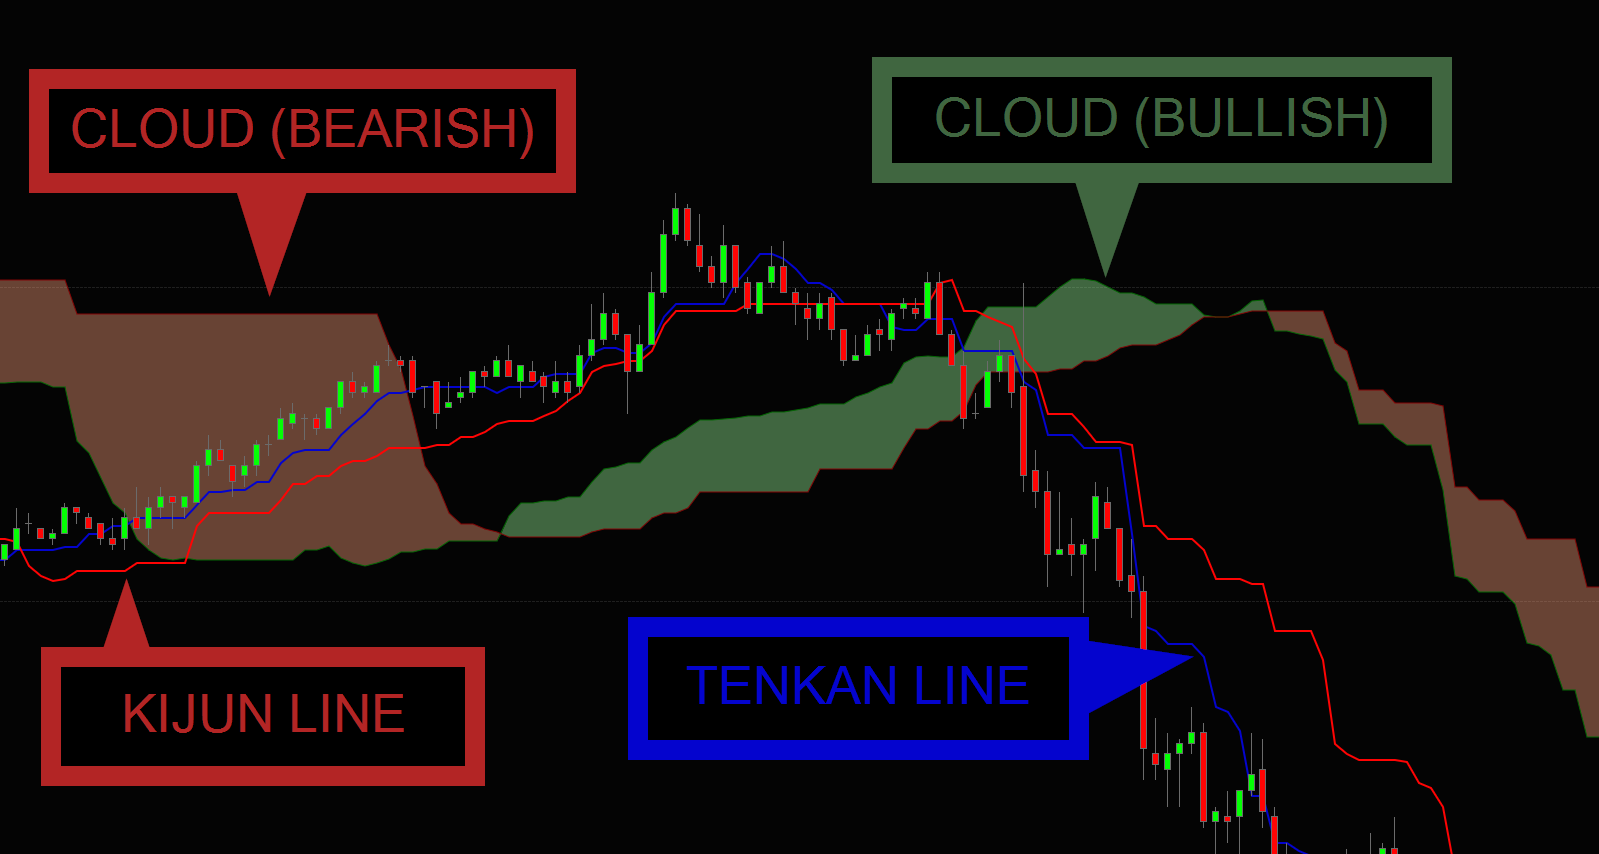
The Ichimoku indicator is a versatile indicator that defines support and resistance, identifies trend direction, gauges momentum and provides trading signals. Even though the Ichimoku indicator may seem complicated when viewed on a chart, it is really a straightforward indicator after a little practice.
The Cloud (pictured in red and green below) is the most prominent feature of the Ichimoku indicator. There are two ways to identify the overall trend using the Cloud:
Traders will often use the cloud as an area of support and resistance depending on the relative location of the price. The cloud provides support levels that can be projected into the future. This sets the Ichimoku apart from many other technical indicators that only provide support and resistance levels for the current date and time.
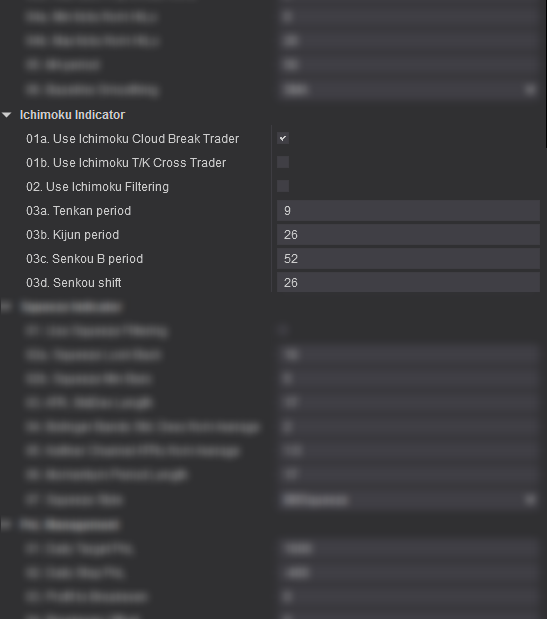
01a. Use Ichimoku Cloud Break Trader
When true, the Ichimoku Cloud Break Trader conditions for a trade will take effect. See HOW TO USE IT section below for details
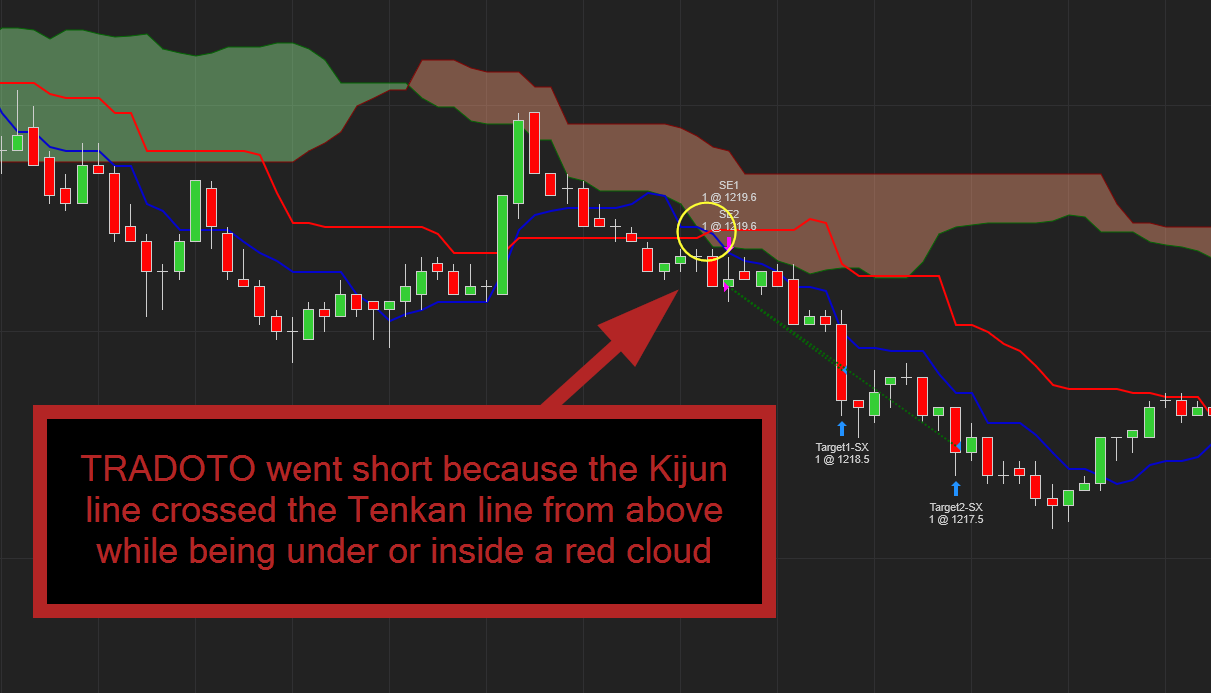
01b. Use Ichimoku T/K Cross Trader
When true, the Ichimoku Tenkan/Kijun Cross Trader conditions for a trade will take effect. See HOW TO USE IT section below for details
02. Use Ichimoku Filtering
When true, the strategy will use the Ichimoku indicator to filter all active trading modes. This lets you define precisely in which condition the strategy is allowed to take trades. Those conditions are:
03a. Tenkan Period
Tenkan-sen, or conversion line, creates a moving average of the highest and lowest prices over the past nine periods. It is used to present both support and resistance information. Leave the period value set to 9 (default) unless you wish to test a different variation of Ichimoku.
03b. Kijun Period
Kijun Line is the midpoint between the highest high and lowest low over a specified period of time. Leave the period value set to 26 (default) unless you wish to test a different variation of Ichimoku.
03c. Senkou B Period
The Senkou Span B lines is used to create the cloud of the Ichimoku indicator (combined with the Senkou A). Senkou Span B is used to give traders an idea of future support and resistance. Leave the period value set to 52 (default) unless you wish to test a different variation of Ichimoku.
03d. Senkou Shift
Number of bars to shift the cloud forward in the future. Leave the value set to 26 (default) unless you wish to test a different variation of Ichimoku.
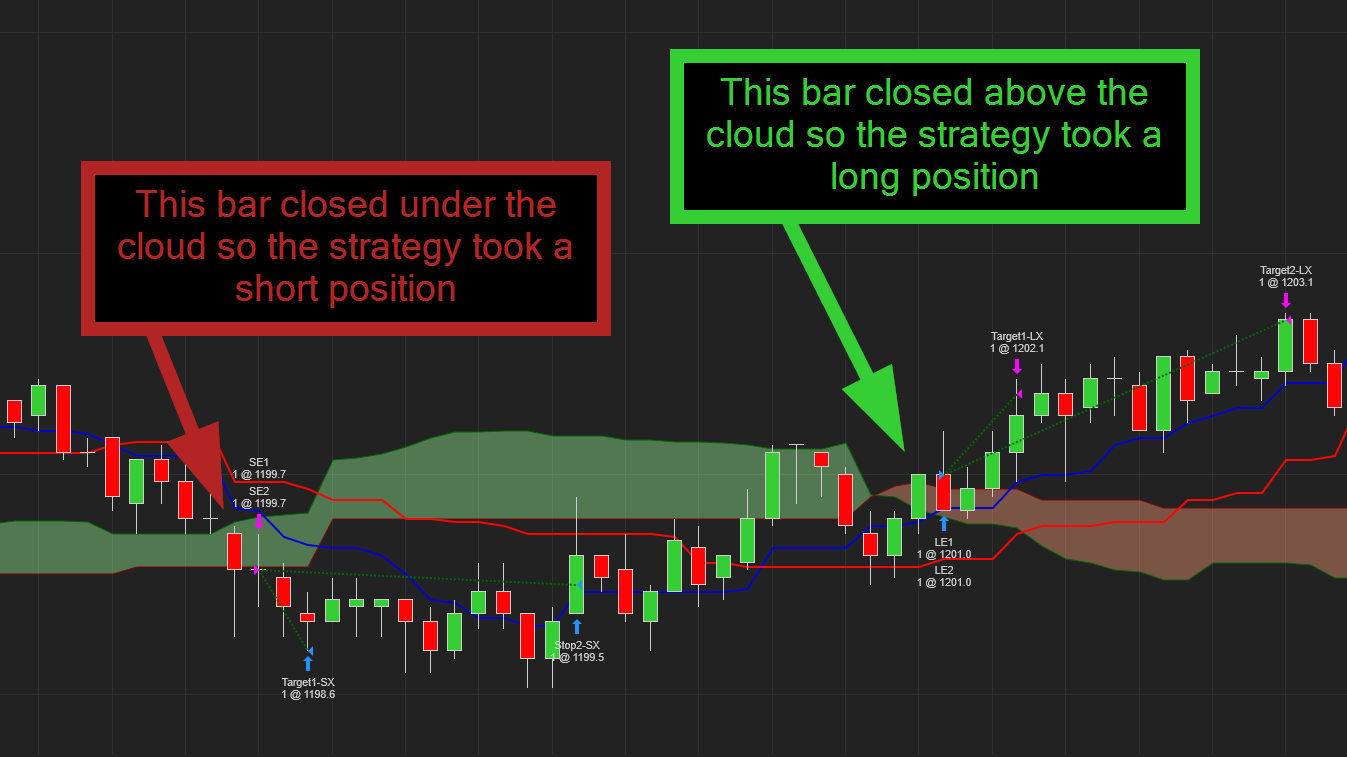
CLOUD BREAK TRADER – 100% AUTOMATED TRADING MODE
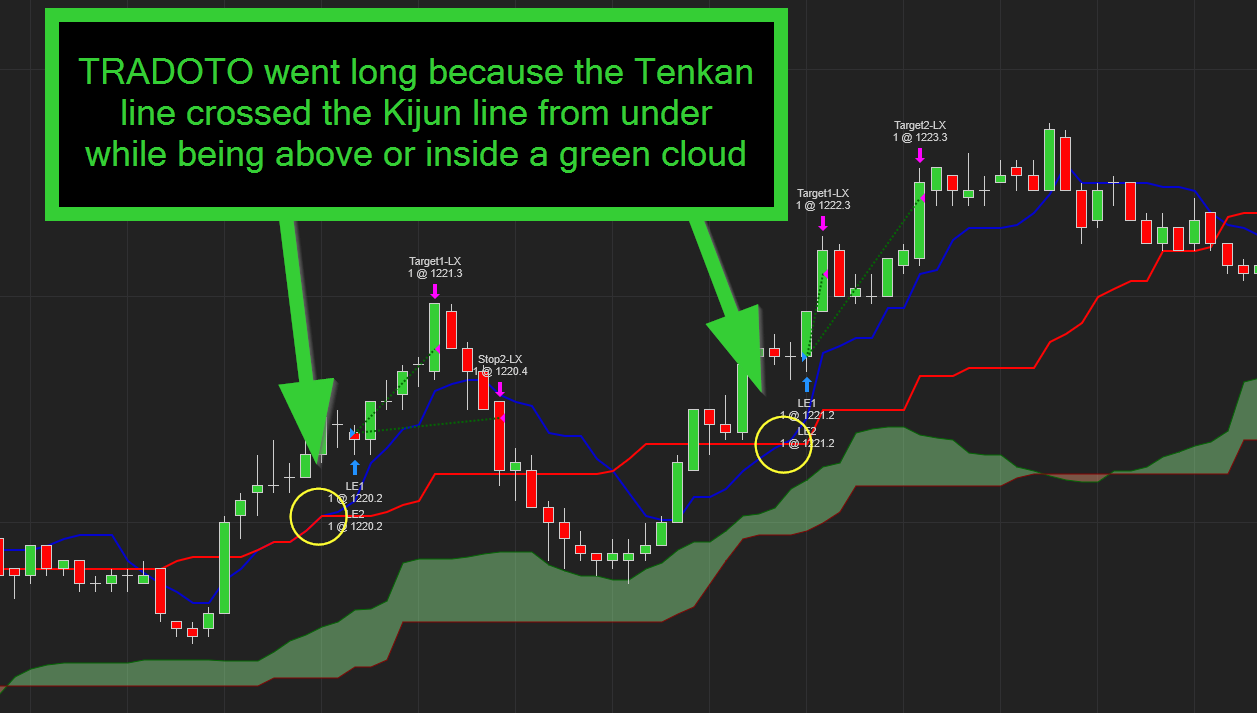
TENKAN / KIJUN CROSS TRADER – 100% AUTOMATED TRADING MODE
GLOBAL TRADING FILTER
When the Use Ichimoku Filtering input is checked, the Ichimoku trading logic will filter all active trading modes.
The following logic will be enforced:
ORDER EXIT MANAGEMENT
When the “Use Ichimoku Exit” input is checked (located in the ORDER MANAGEMENT section), the strategy will close active trades as soon as the Tenkan and Kijun crosses each other, from under or above.
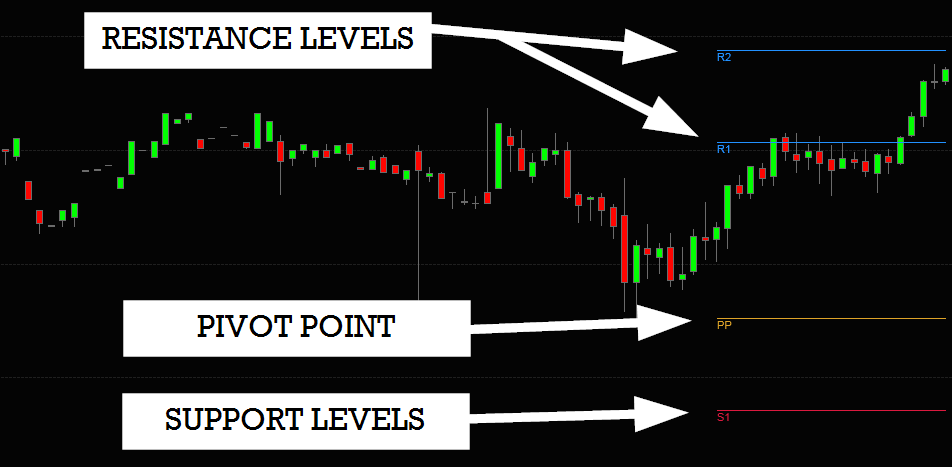
A pivot point is a popular intra-day technical indicator used to determine the overall trend of the market over different time frames. The pivot point itself (labeled PP in orange on the chart) is simply the average of the high, low and closing prices from the previous trading day. On the subsequent day, trading above the pivot point is thought to indicate ongoing bullish sentiment, while trading below the pivot point indicates bearish sentiment.
The pivot point (PP) is the basis for the indicator, but it also includes other support and resistance levels that are projected based on the pivot point (PP) calculation. All these levels help traders see where the price could experience support or resistance. Similarly, if the price moves through these levels it lets the trader know the price is trending in that direction.
Here is a quick recap
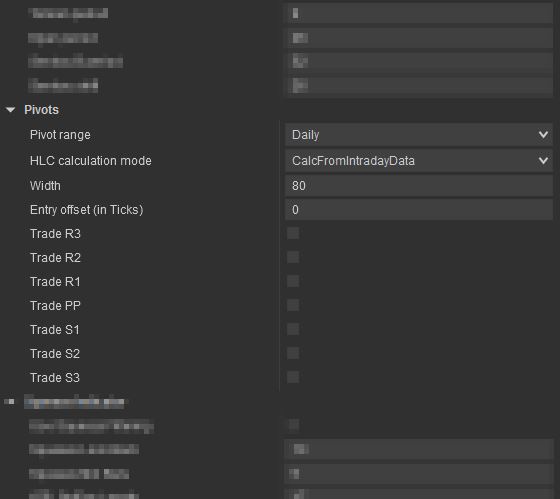
Pivot Range
Select the pivot range that is the best suited for your market.
HLC Calculation Mode
Leave default to “calcFromIntradayData” unless you have experience using other modes
Entry Offset (in Ticks)
Number of tick offset from pivot to take entry. You can use a positive or negative value here, use 0 to trade exactly at the pivot level.
Trade R3/2/1
Enable this to trade the Resistance levels based on the entry offset specified above
Trade PP
Enable this to trade the “Pivot Point” level based on the entry offset specified above
Trade S1/2/3
Enable this to trade the Support levels based on the entry offset specified above
CLOUD BREAK TRADER – 100% AUTOMATED TRADING MODE
TENKAN / KIJUN CROSS TRADER – 100% AUTOMATED TRADING MODE
GLOBAL TRADING FILTER
When the Use Ichimoku Filtering input is checked, the Ichimoku trading logic will filter all active trading modes.
The following logic will be enforced:
ORDER EXIT MANAGEMENT
When the “Use Ichimoku Exit” input is checked (located in the ORDER MANAGEMENT section), the strategy will close active trades as soon as the Tenkan and Kijun crosses each other, from under or above.
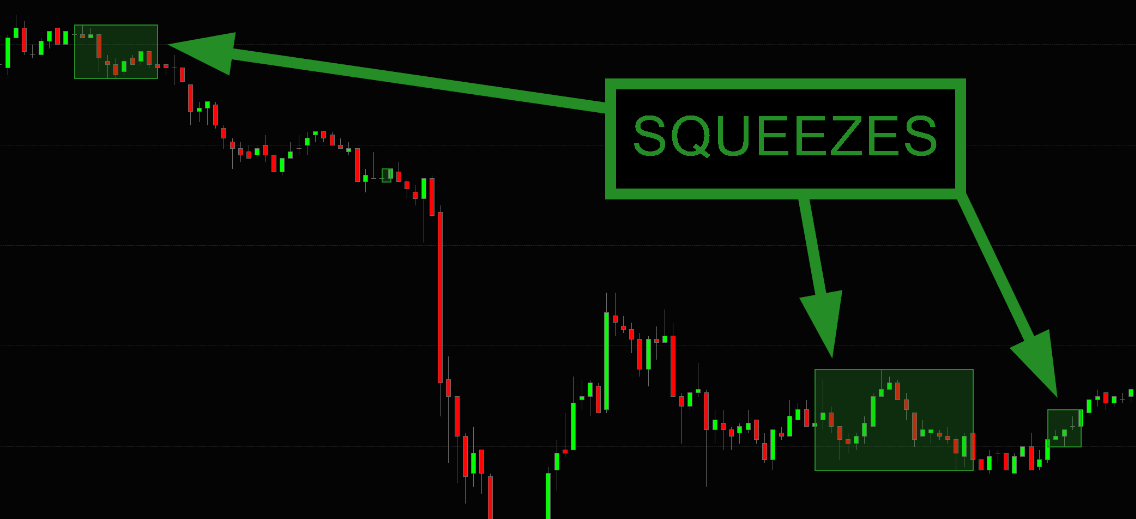
The Squeeze is the central concept of Bollinger Bands. Bollinger Bands are a highly popular technical analysis technique.
Many traders believe the closer the prices move to the upper band, the more overbought the market, and the closer the prices move to the lower band, the more oversold the market. When the bands come close together, constricting the moving average, it is called a squeeze.
A squeeze signals a period of low volatility and is considered by traders to be a potential sign of future increased volatility and possible trading opportunities.
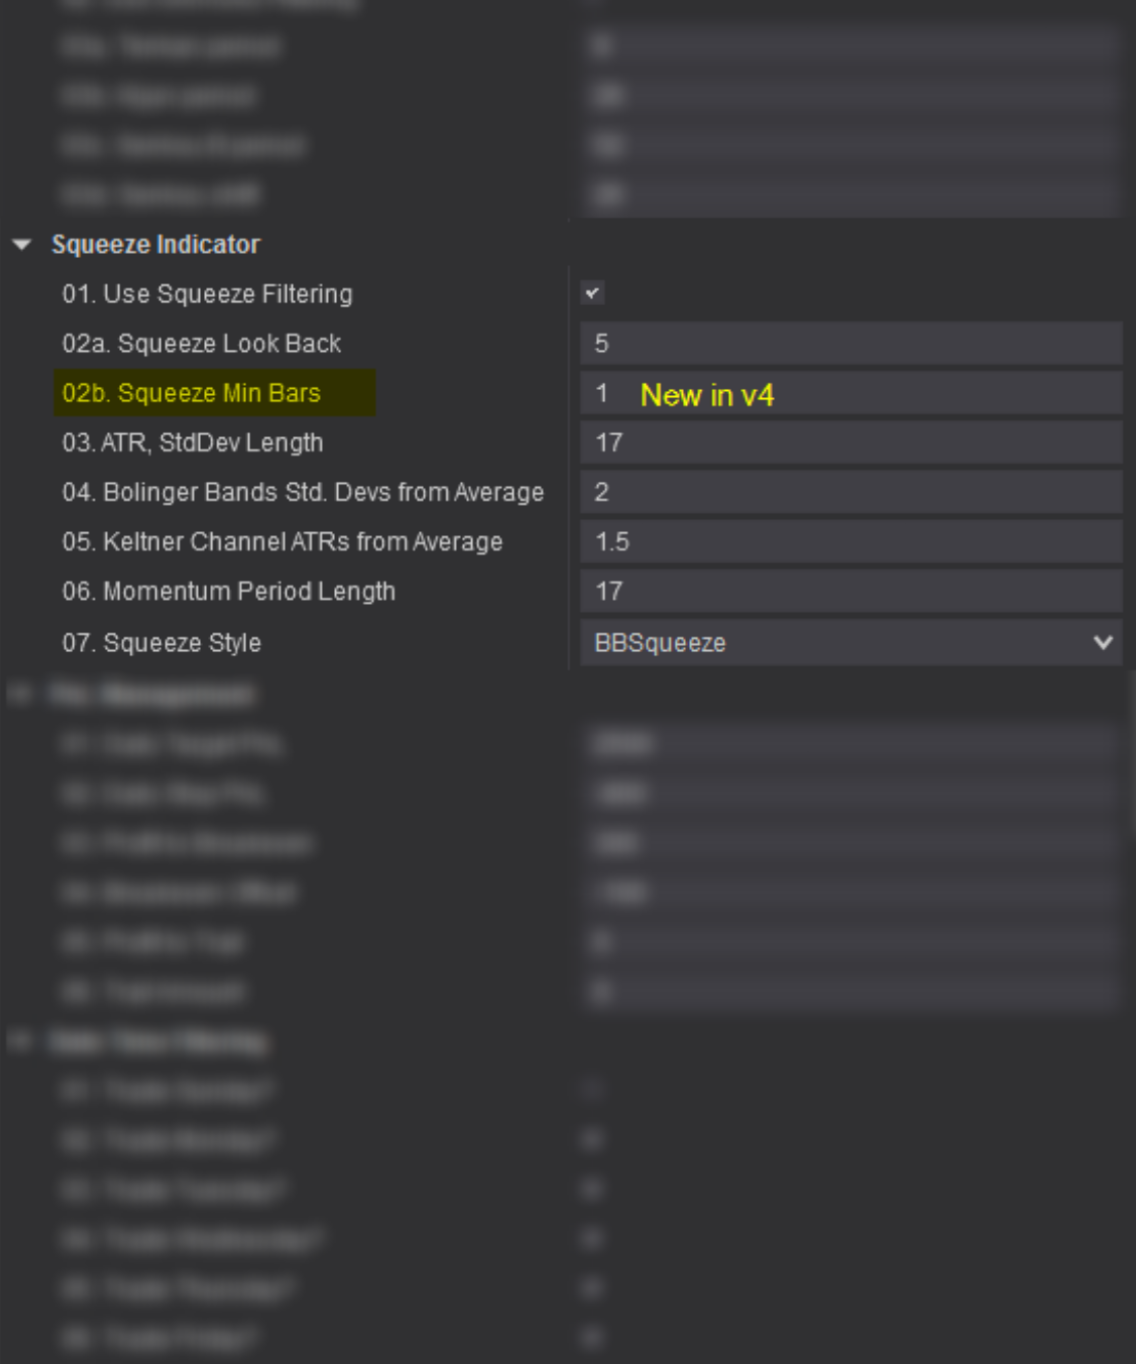 01. Use Squeeze Filtering
When enabled, the strategy will trade only when the price action is in squeeze mode and also for X bar following the last squeeze as defined in the Squeeze Loop Back input below.
02a. Squeeze Loop Back
Tells the strategy to look back “X” amount of bars to see if a squeeze happened between the current price and the “X” number of bars away point (ie. 10 bar loopback, 5 bar loopback, etc.). If a squeeze is found, the strategy will keep itself enabled until the squeeze can no longer be found within that “X” bars range.
02b. Squeeze Min Bars [New in v4]
Define how many bars in squeeze mode are required for the strategy to acknowledge that the price action is in squeeze mode. This input helps reduce brief squeeze instance that last a very short time
03. ATR. StdDev Lenght
This lets you set the ATR and StdDev Lenght, leave default if you are not familiar with it
04. Bolinger Bands Std Devs from Average
This lets you set the Bolinger Bands Std Devs from Average, leave default if you are not familiar with it
05. Keltner Channel ATRs from Average
This lets you set the Keltner Channel ATRs from Average, leave default if you are not familiar with it
06. Momentum Period Length
This lets you set the Momentum Period Length, leave default if you are not familiar with it
07. Squeeze Style
Choose the squeeze style, we recommend leaving it to default “BBSqueeze” if you are not familiar with the different options
For example, if you set the loop back to 10, it will look up 10 bars back from the current price and let the strategy place trades if a squeeze is found within that range and stop all new trade after the squeeze is no longer detected. When set to zero, the strategy is turned off as soon as the squeeze ends.
GLOBAL TRADING FILTER
By enabling the Use Squeeze Filtering input, TRADOTO can take advantage of the Squeeze indicator with any automated trading mode by allowing trades to be taken only when the price action is in Squeeze mode or within a number of bars following a squeeze as specified in the “Squeeze Loop Back” input . When no squeeze are detected , the strategy is switched OFF until a squeeze appears again.
This section lets you configure how the strategy manages your daily unrealized and realized PnL combined.
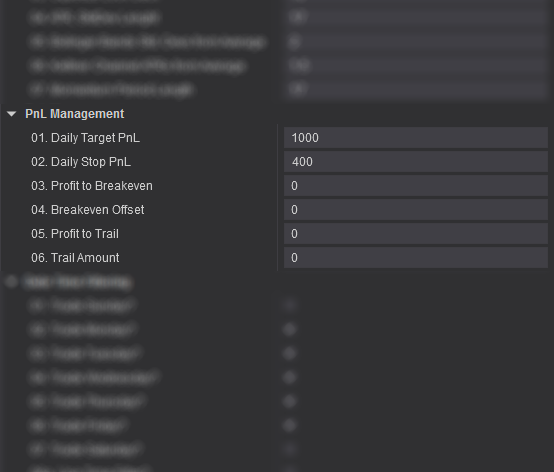
01. Daily Target PnL
Stop trading after this much realized and unrealized profit is reached for the day (reset daily at the end of the day)
02. Daily Stop PnL
Stop trading after this much realized and unrealized loss (use a positive value) is reached for the day (reset daily at the end of the day) i.e. 400 = a loss of 400
03. Profit to Breakeven
After this much profit is reached, move stop PnL to breakeven
04. Breakeven Offset
When PnL is moved to breakeven, offset it by this much profit (for example, if set to 200, the strategy will disable itself and close all positions if the realized and unrealized profit combined reaches $200)
05. Profit to Trail
After this much realized and unrealized profit is reached, start trailing PnL. Set to a large value to disable
06. Trail Amount
Once trailing is enabled, trail PnL by this much profit (for example, if set to 400, the strategy will stop trading if the realized and unrealized profit combined drop by over $400)
This section lets you configure when the strategy will be active, which day of the week and what part of the day.
We provide 4 different time filters, meaning you could have the strategy start and end 4 different times on the same day. This is useful if you wish to avoid certain timeframe during the day. Say for example there is a major event scheduled on your traded instrument at 10AM daily, you want to have the strategy disabled at that time. To do that we will have to set two time filters to TRUE, the first active filter will be from the beginning of the day to say 9:55AM and the second time filter will be from 10:05AM to end of day.
You are welcome to swing trade using our strategy, an open position will not be closed at the end of the day if you have the TIME IN FORCE input set to GTC (Good ‘Til Canceled). Though, do keep in mind that the informative CLOSED PNL box in the lower left corner will reset to 0 daily at midnight.
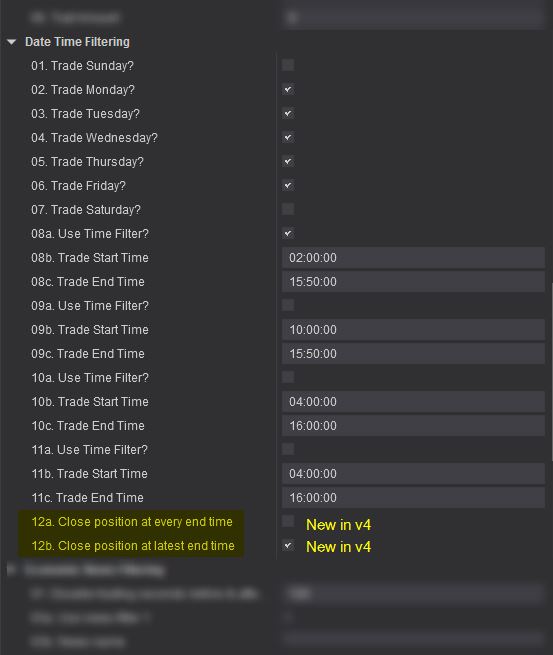
Trade (DayOfTheWeek)
Specify which day of the week the strategy will be active
Use Time Filter?
Set to TRUE to enable a time range in which the strategy will be active
Trade Start Time
Specify the exact time the strategy will be enabled. Use this format HH:MM:SS
Trade End Time
Specify the exact time the strategy will be disabled. Use this format HH:MM
Close position at every end time [New in v4]
Tells the strategy to close open positions for every end time specified, useful to ensure that no trade are open between time filters.
Close position at latest end time [New in v4]
Tells the strategy to close open positions at the last end time specified, required to ensure that all trades are closed at the end of the trading session.
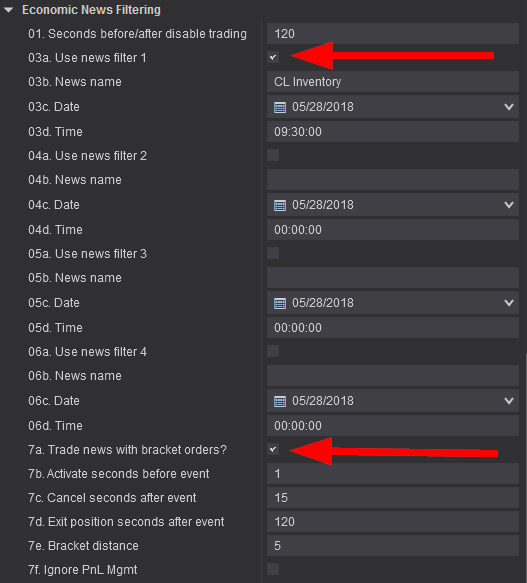
The Economic News Filtering & Trader let’s you trade precisely and safely huge volatile price action moves caused by scheduled market economic news events.
More details coming soon
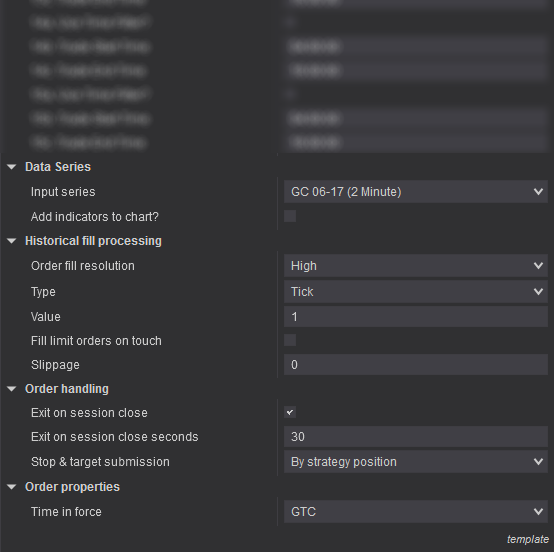
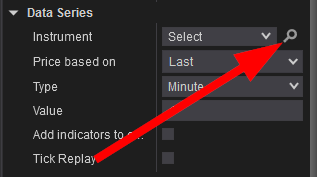
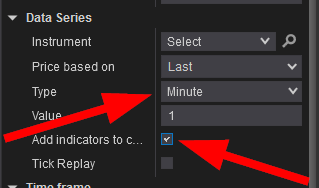
Input series
Set your instrument to trade here. This will be set automatically based from which chart window you added the strategy
Add indicators to chart?
When ENABLED, the indicators that the strategy uses will be added to your chart. This feature is very useful when reviewing trades taken in theSTRAEGY ANALYZER window under the chart tab as this tab cannot use a custom chart template.
Sets the way that simulated historical orders will be processed by the strategy. See the Understanding Historical Fill Processing page for more information.
Exit on session close
When enabled, open positions will be closed on the last bar of a session
Exit on session close seconds
Sets the number of seconds prior to the end of a session at to close any open positions held by the strategy
Stop & Target submission
Sets how stop and target orders are submitted. Leave default unless familiar with those options
The time in force for an order defines the length of time over which an order will continue working before it is canceled
Time in force
Select either GTC or Day
DAY – A Day order is canceled if it does not execute by the close of the trading day. Unless otherwise specified, every order is a Day order.
GTC – A Good-Til-Canceled order will continue to work within the system and in the marketplace until it executes or is canceled.
This lower right corner button let you load and save strategy templates. very handy during optimization and when trading multiple instrument to quickly go back and forth between different configurations.
Please submit all support related inquiries by clicking the SUPPORT menu button in the upper right corner of this page
If we need to remote access your computer, we will have you click the button below to launch our remote access tool (no install required). Once the tool is running, please share the ID and Password displayed.
Most errors encountered by our members to date have been caused by their NT8 platform, we recommend doing a clean install to ensure the issue you are having isn’t caused by your local platform, listed below are the steps required to perform a clean install, please try that and create a support ticket if you are still having issues
This is your dashboard. From here you can download, install and learn everything there is to know about our fully automated trading strategy. Please follow the steps below to get started.
The NinjaTrader guide will show you every steps needed to setup our automated strategy on your computer and how to start trading with it.
Every automated trading modes and inputs found in our strategy control panel is defined in the USER MANUAL in great details.
It is crucial that you become familiar with what each input in the strategy is about in order to start perfecting the strategy to your favorite instrument.
After going over the platform guide and user manual tabs, it is time to put what you’ve learned into practice:
1. Explore how TRADOTO fully automated trading modes trade on the chart with historical data and live data (Futures, Forex, Stock)
2. Decide which trading mode works best for your capital size/risk tolerance and start optimizing your own configuration over a few months time-frame.
3. Once you’ve come up with a strategy configuration that you like, start applying it in market replay to see it trade in real time then switch to SIM mode for a few days.
4. Finally, there will be a time where you will have full confidence in how TRADOTO trades for you and trust its consistency/reliability. From that point forward, you can start trading LIVE with real money!
Download the latest NT8 version and install it using the default settings.
We require your Ninja Trader MachineID in order to enable your use of the TRADOTO strategy that you purchased from us. Use the form below to submit it.
That information can be found from the Help > About menu in NinjaTrader. It is a string of 32 alphanumeric characters, with no dashes. Please be sure that you do not submit your NinjaTrader License ID.
The TRADOTO strategy can be licensed and used on one machines. If you plan to upgrade your computer hardware or replace it with a new one, you must resubmit your new MachineID to us before the strategy can be used again.
If you need to run TRADOTO on two platforms simultaneously, you can add a second and third machine ID to your account by purchasing it HERE
You can download the latest version of TRADOTO and review our strategy change log below. We also email all active members every time we release a new version.
Version 5.0 (New - August 2021)
NEW TRADING MODE
– New trading mode leveraging the popular Pivot indicator. You can now trade your favorite support and resistance pivots levels fully automated with our fully featured order management Algorithm, enjoy!
NEW FEATURE
– Revamped strategy layout to speed up learning curve and facilitate optimization
– You can now enter on pullback with a pre defined offset to optimize your entry price event more!
– New input to let you ignore cloud position in relation to price to increase trading flexibility when using the Ichimoku trading mode
– You can now trail your stop based on the last support or resistance level!
– Added new input to avoid entry on choppy price action when using the swing trading mode
– New algorithm to close a partially filled entry position when STOP/TARGET is hit to avoid having a re-entry on the remaining unfilled position.
– Added new input to bypass T/K alignment when using the Cloud Break Trader
– HiLo trader filtering input can now be applied globally to all trading modes
– Swing entry offset can now be used with a negative value to place trades before support or resistance levels are broken
– Improved fill accuracy with TopStepTrader pre-funded accounts
Version 4.0
NEW TRADING MODE
– Introducing two brand new trading modes leveraging the Ichimoku indicator, see user manual for all the details.
NEW FEATURE
– New and improved strategy control panel layout
– Brand new trading mode to leverage the popular ichimoku indicator
– New input to let you trade in one direction, short or long. This can be helpful in some markets where you see that the daily chart is extremely bearish or bullish.
– New merged trading execution mode to let you see historical trades while trading LIVE
– You can now specify your position sizing in quantity or “Capital to risk” to let TRADOTO dynamically calculate the number of contract/shares to buy depending on the capital entered.
– You like to use percentage to calculate how far your target an stop should be? you can now do that thanks to the “Target/Stop calculation method” input.
– Added input to pause the strategy X number of bars between trades to avoid over-trading when using lower timeframes.
– You can now define the minimum squeeze duration before the strategy is turned on.
– Added input to either close position at the last time filter only or all the time even between time filters.
– New order exit method leveraging the Ichimoku indicator for improved trailing method.
– HiLo trader filtering input can now be applied globally to all trading modes
– Swing entry offset can now be used with a negative value to place trades before support or resistance levels are broken
– v4.0.1.6: Added new input to bypass T/K alignment when using the Cloud Break Trader
– v4.0.1.14: Implement new algorithm to close a partially filled entry position when STOP/TARGET is hit to avoid having a re-entry on the remaining unfilled position.
BUGFIX
– v4.0.1.5: Fix input naming typo and resolve minor conflict when combining the hilo filtering with itchimoku
– v4.0.1.6: Fix HiLo filtering conflict when used with other trading indicator modes
– v4.0.1.9: Fix historical trading engine inaccuracy with stops and tailing caused by the latest NT platform version update.
– v4.0.1.12: Improve partial fills handling when using stop limit entries
– v4.0.1.14: Resolve error when enabling news filter
– v4.0.1.16: Resolve PnL sync issue with TopStepTrader Data feed
Version 3.0.1.15
NEW FEATURE
– Added Squeeze box to the chart in order to easily visualize when the market is in squeeze (default when using the TRADOTO template)
– Added new ROLLOVER indicator: Shows a button on the chart in the upper right corner to roll the instrument to the front month (default when using the TRADOTO template)
– Added market economic news filters to easily cancel trading when the market is volatile
– Added a new “Economic News Filtering” trading mode to trade market economic news events
– Added input to leave open position open when the end time filter is reached to let ongoing trade close via STOP or TARGET
– Added input to pause the strategy when a trade ended using HiLo trader to avoid overtrading situations if the price stays within the entry zone for too long
BUGFIX
– Optimizes the order management engine to improve speed and accuracy when working with high volatility markets.
– Recode how the order management handles stops distance to allow the stop to be placed closer to the entry point (useful when trading forex)
Version 2.1.0.2
NEW FEATURE
– Added info message next to PnL counter in lower left corner when daily max profit/loss is reached: “Daily Limit reached – trading stopped”
– Added pop up error message when disabling strategy with open position: “Strategy disabled with open position – check your position to be sure it is as you desire”
– Added pop up error message when strategy is unable to fill an order due to a platform or brokerage problem: “Strategy stopped due to rejected entry order – verify that you are flat”
BUGFIX
– Error handling engine has been revised from [cancel everything & close position] to only ignore errors as this was introducing conflicts with the platform default error handling actions.
– Resolved issue where a time filter or stop order was rejected resulting in open positions
Version 2.1.0.1
NEW FEATURE
– A brand new trading mode is being introduced called HiLo Trader. It allows the strategy to trade of HiLo Crossovers. More details can be found in the User Manual.
– Indicators can now be plotted on the chart while using the Strategy Analyzer window by enabling the “Add indicators to chart?” under the DATA SERIES section.
– The control panel layout has been revamped to bring the most accessed section to the top.
BUGFIX
– We’ve resovled a bug that was causing the strategy to crash by trying to submit an order in historical mode instead of real-time while connected to SIM.
Version 2.0.14.0
BUGFIX
– NinjaTrader version 8.0.5.2 introduces new codes for order management on strategies. We’ve included those new languages to be fully compatible with this latest release
Version 2.0.10.0
NEW FEATURE
– Strategy Analyzer back-testing reliability has been improved in the latest version of Ninjatrader 8.0.5.2, our strategy code has now been updated to fully take advantage of this tool (see STRATEGY OPTIMIZATION tab for more details)
BUGFIX
– Resolve a bug where the strategy was trying to cancel an order already pending cancellation.
– Fixed a HiLo indicator sound alert option that wasn’t working.
Version 2.0.8.0
NEW FEATURE
– Improved layout to speed up enabling and disabling the strategy from the chart. The most useful sections are now pinned to the top and least useful ones moved to the bottom. Please review the user manual for clarification.
BUGFIX
– Resolve an issue where the breakeven PnL feature would be stuck in a loop
– Enabling the squeeze indicator was preventing the strategy from running
Version 2.0.6.0
NEW FEATURE
– Automatically close active and pending trades after the platform loses connection to the exchange and reconnect. To enable this new feature, be sure to enable the KEEP RUNNING handling feature as detailed on the CHANGE OPTIONS starting guide tab.
BUGFIX
– Resolve intermittent issue where a position is left without stop loss and targets.
– Correct Closed PnL syncing issue when a trade is closed after reaching time filter end time.
Version 2.0
NINJATRADER 8
Our strategy is now compatible with NinjaTrader 8.
STRATEGY TEMPLATES
This was our most requested feature, the ability to save and load templates to speed up the optimization process, we’ve now added support for templates, enjoy!
OPPOSITE MODE
We were seeing a lot of trading opportunities where taking reversal trades was very profitable in certain trading hours and with the right offset for entry. This feature will let the strategy place a LONG trade where it would usually go SHORT or go SHORT where a LONG would occur.
REAL TIME PNL MONITORING
Previously the STOP and TARGET PnL was acting only on the realized PnL (closed trades), this often made the strategy go beyond the max loss/profit on the day by ignoring ongoing/unrealized trades. Starting in version 2, the PnL management will be done in real time by actively monitoring the unrealized PnL as well.
PNL BREAK EVEN & TRAILING
This new feature adds break end and trailing to the daily target PnL as soon as the combined unrealized/realized target PnL is reached on the day. This will avoid being in the green at the start of the day but ending the day in the red.
Version 1.0
This is the only version compatible with NinjaTrader 7. If you would rather use our strategy on NT7, please follow the V1 Starting Guide and review the V1 User Manual linked below. We still provide BUGFIX support for version 1 but new features are only added for the NT8 platform going forward as the coding is drastically different between NT7 and NT8..
Follow the steps pictured below to import your strategy ZIP file, after step 3 pictured below, find the TRADOTO ZIP file and open it to start the import process. After the import complete, restart the NinjaTrader platform
If you are upgrading to a newer version of our strategy, you might encounter this error upon importing the strategy.
To avoid this problem, ensure you have removed any strategy added on charts or from the strategy tab. Then follow the steps below:
If the import is still failing after removing the NinjaScript Assembly as shown above, please manually remove the strategy files as follow.
Lastly, if both solutions above didn’t help, please perform a NT8 factory reset as shown below:
Next let’s add your data provider/broker connection so the platform can connect to the exchange and receive market data. if you haven’t signed up with on, you can review compatible brokers on this page http://ninjatraderecosystem.com/Brokers.php
Your broker will provide you the configuration details. For your reference, here is how the Ninja CQG provider connection is added: http://ninjatrader.com/ConnectionGuides/CQG-Connection-Guide
NinjaTrader offers FREE live futures data (not delayed) for SIM trading by signing up HERE. The connection expires after a few weeks, at which point you can renew again from the same page and using the same email address or fund a real account to use a permanent connection to the exchange.
Setup your chart and instrument by following the steps below.
If you are trading futures, be sure to rollover your instruments on the expiration date. See 2nd picture below for more details on how this is done in NinjaTrader 8
TIP: to delete instrument from the instrument list after adding from the lookup tool, simply highlight it on the list and press DEL on your keyboard
Once your machine ID has been submitted and registered, you can enable the strategy using two different approaches, both pictured below. Method 1 is done from the chart and method 2 from the control center strategy tab
Please note that with method 2 it will not display the closed pnl counter in lower left corner on the chart.
Pictured below is how the TRADOTO strategy is enabled on the chart, be sure to make changes to it or disabled it from the chart as well by disabling the strategy first and clicking APPLY. Mixing Method 1 and method 2 (shown below) could produce platform issues, always use the same method.
Please only enable one strategy per chart. Simply open a new chart window to trade additional instruments
Once your strategy has been enabled from the strategy tab as pictured below, be sure to make changes to it or disabled it from the strategy tab as well. Mixing Method 1 and 2 could result in some platform issues, always use the same method.
The best way to quickly assimilate what each input in our strategy does, is to setup a workspace with a monitor dedicated to the TRADOTO User Manual and the secondary monitor for your favorite chart instrument with a few days of historical data to play with. (you can increase the number of days loaded on the chart by right clicking on an empty spot on the chart > DATA SERIES > DAYS TO LOAD)
With this workspace, you’ll be able to quickly study each input and how they impact trading result by flipping the strategy ON/OFF after making minor adjustment. The changes you make will reflect instantly on the chart by showing you where the entry and exit would have been taken (as pictured below). A good exercise is to analyze the trade taken on the chart and improve them by slowly altering each inputs until the day is very profitable, this helps build a very strong understanding on how our strategy works. Be sure to practice with all TRADING MODE we offer so you can then focus your OPTIMIZATION phase with your favorite exclusively (more details on the this phase is found in the BACKTEST OPTIMIZATION tab after)
After playing with historical data, we advise taking it to the next level by running your configuration in REPLAY MARKET to see the trade enfold in REAL TIME, this is more time consuming but very eye-opening so be sure to spend time on that as well. You can learn more about MARKET REPLAY in the next tabs.
Before using our strategy on the LIVE market, it is required to find your optimal strategy configuration using BACKTEST.
Optimizing your strategy means going over multiple weeks/months of market price action to see how a strategy configuration performs longer term. Before optimizing, be sure to fully understand all the strategy parameters covered in the user manual. Once this all make sense, you’ll want to start testing several configuration iterations using BACKTEST in the strategy analyzer window.
The first step to determine the validity of a trading idea is to backtest your configuration versus historical market data. Backtesting helps you identify quickly a potentially effective strategy configuration and serves as a starting point. Backtesting provides a bird’s eye view of how your strategy configuration may perform in a real-time trading environment. Testing various configurations and observing their results is an excellent way to get started and get different ideas brewing.
Backtest results generated with our strategy are accurately representating live trading trades, keep in mind that minor differences can be found from time to time as backtest works with 4 data points per candle (OHLC: Open/High/Low/Close) while real-time trading provides a tick by tick data feed which is way more detailed than backtest. For the closest profit representation, we recommend using the market replay mode, visit the market replay optimization tab for more details on this step. If you are seeing a lot of different result between your LIVE and BACKTEST trade, make sure that you are using the HIGH FILL RESOLUTION mode (not STANDARD) at the bottom of the tradoto control panel as this will ensure the NinjaTrader trading engine is provided with the most historical price action details, more details on this feature here.
In this two videos, we will go over how the strategy analyzer tool works and how backtest optimization is performed with our strategy. For more details on the Strategy Analyzer tool, you can consult the official NT manual as well.
For example, using 1 contract with a stop distance of 20 ticks or 2 contract with a stop of 10 ticks will cost you $200 per bad trade when trading Crude Oil which cost $10 per tick, in that case set your max daily loss to -400 to allow two bad trade in a row at least.
Once a profitable configuration is found through backtesting, expanding testing to MARKET REPLAY will help validate your results in a real time simulated environment.
Market Replay is the ability to replay market data it as if it was happening in real-time. You can trade in simulation against this data at varying levels of replay speed. This feature bring the most accuracy in strategy results, it is the best way to confirm that your strategy configuration (optimized in backtest) is working as expected.
The video below will walk you through how this feature works in NinjaTrader.
We strongly advise to setup text notification alerts on your phone to be alerted immediately when an error occurs on your platform, this is crucial to have when away from the computer!
Below is a list of known e-mail provider settings demonstrating e-mail alerts configuration within NinjaTrader.
For step 7 pictured below, you’ll need to enter your personal email provider server settings, if your domain configuration isn’t listed under the picture, please research online what you should be using for your own email server.
Lastly in Step 7, the EMAIL ADDRESS field should be your phone carrier text messaging email address in order to receive alerts directly on your phone via SMS, if you unsure what it is, please research online or call your phone carrier to ask them (this should be the format: yourphonenumber@yourcarrierdomainname)
AOL:
Please note the user name may or may not contain “@aol.com”.
Server: smtp.aol.com
Port: 587
SSL: Enabled
User: “YourUserName” or “YourUserName@aol” Note: New accounts require “@aol.com” in username.
Password” “YourPassword”
GMAIL:
Please note the user name does NOT contain the “@gmail.com”.
Server: smtp.gmail.com
Port: 587
SSL: Enabled
User: “YourUserName”
Password” “YourPassword”
HOTMAIL:
Please note the user name contains the “@hotmail.com”.
Server: smtp.live.com
Port: 587
SSL: Enabled
User: “YourUserName@hotmail.com”
Password” “YourPassword”
YAHOO:
Please note the user name does NOT contain the “@yahoo.com”. Also you must enable ‘POP’ within your email account as shown HERE
Note: Yahoo may require a paid account for utilization of the SMTP/POP services.
Server: smtp.mail.yahoo.com
Port: 587
SSL: Enabled
User: “YourUserName”
Password “YourPassword”
Once your mail setup is complete, please test your configuration as pictured below to ensure you are receiving SMS alert on your phone. Simply set the HiLo Activator and the SWING indicator to FALSE, then enable the strategy to trigger the error pictured, an SMS alert will be sent to your phone within the next 10 seconds.
Automated trading strategies leave pending orders on your broker servers waiting to be filled. When the internet connection goes down where the strategy is running, the pending order is left running on the broker side unattended, this means that if the price action hit that order, the platform running the strategy won’t be online to submit the usual stop and limit orders to manage the active trade.
For this reason, you must be aware when the internet goes down so you can promptly cancel any pending order left on the broker end and reconnect your strategy when the internet is back up
There are many websites that offer monitoring services, to start monitoring your home internet connection, you must ensure you have a STATIC IP address, then you can enable monitoring using a site like this one http://uptimerobot.com/ (to receive SMS alert instead of email, simply set the primary email to the same email address used in the MOBILE SMS TEXT NOTIFICATION tab above, that email will relay new emails to your phone number directly)
Another option is to setup your platform on a trading Virtual Private Server (aka VPS). Those dedicated server are hosted offsite close to the exchange for faster fill and will have a static IP address. You can then use their server static IP address with your monitoring site. Here is NinjaTrader recommended VPS provider http://www.ninjatraderbrokerage.com/hosting_services
To ensure the strategy can cancel all pending and active orders In case your platform loses internet access, we need to advise the NinjaTrader 8 platform to leave the strategy running when the platform loses and restore internet access. Please follow the step below to do so:
Also we recommend to Uncheck the “confirm order placement” option as pictured below to avoid the repetitive warning pop up every time the strategy is turned on:
Most markets become highly volatile when important news event surface. It is highly recommended that you anticipate when those events occur to either turn off the strategy in order to avoid slippage or customize it to maximize profits and safety.
Here is a list of popular economic calendar sites, some even offer mobile application to receive alerts on your smart phone (filter the importance of the news to only show medium and high events and focus only on the instrument you are trading of course).
By default, your computer will go into sleep mode after a period of inactivity. in order for TradOTO to run 24/7 your computer must remain powered on all the time, watch this video to learn how this is done on a Windows 10 computer:
After a few months of LIVE trading with great results, we recommend migrating your platform in the cloud for greater reliability/uptime and reduce your slippage with a server located closer to the exchange.
This cloud hosted server solution also lets you easily remote access your TRADOTO platform from anywhere, even your phone.
We advise to setup your VPS with the Windows Server 2012 operating system (version 2019 will require more ressources to run at similar speed), at least 3GB RAM and a CPU with 2 cores. Our recommended VPS provider is VPSSERVER which offers those hardware specifications for as low as $29.99/m, you can sign up for a 7 day free trial using the button below.
This User Manual covers everything there is to know about the TRADOTO strategy
Choose the trading mode that best suits you then start optimizing your instrument with it. To quickly understand the mechanism behind those trading mode, be sure to try them from a chart in Market Replay to see them work in REAL-TIME and historical backtest mode as well to instantly see how the strategy would have traded in the past.
– The Trading Mode tab let you activate one of many fully automated trading mode we offer
– The order entry/exit management tabs tells the strategy HOW to trade
– The Swing / Hilo / Ichimoku / Pivots / Squeeze tabs go over TRADOTO core indicators that tells the strategy WHAT to look – for when placing trades.
– The PnL Management tab below tells our strategy when to stop trading during the day when a specific profit or loss is reached.
– The Date Time Filtering tab below tells our strategy WHEN to start and stop trading each day of the week.
The most effective way to study our strategy is having the user manual page on your secondary monitor and opening a chart of your favorite instrument on the primary monitor, with this workspace you’ll be able to put in practice how each input affect trading performance on the chart, simply switch the strategy ON/OFF using the BACKTEST trade execution mode to have trades instantly drawn on the chart.
Account
Sets the account for which the strategy will trade against, make sure this match your active connection, Sim, Replay or Live
Calculate
Dictate when the indicators values are calculated, either on bar close, on each tick or on price change. Please leave default with ON BAR CLOSE if you haven’t used other settings in the past.
Label
leave default
Maximum bars look back
Max number of bars used for calculating indicator/internal series values. 256 setting is the most memory friendly.
Min. bars required
Set the minimum bars required for the strategy to calculate, We recommend leaving this default at 20
Start behavior
Leave default with WAIT UNTIL FLAT is recommended, learn more about each option here
Enable
Turn the strategy ON and OFF
This section lets you specify the trading mode to use.
Trading Mode
Select the trading mode you would like to automate your trade with. For a definition of each mode, please refer to their dedicated tabs in the user manual
Trade Execution Mode
This input let’s you switch between different strategy execution mode.
1 – Backtest execution mode is used for optimizing the strategy from the Strategy Analyzer window or generating trades on historical data from the chart window.
2 – Realtime execution mode is used when trading in real-time with SIM or LIVE data and also when using Market Replay.
3 – You can also use the two execution modes at the same time by selecting BacktestAndRealTime from the dropdown menu
Trade Direction
This input allows you to only trade in one direction, short or long. This can be helpful in some markets where you see that the daily chart is extremely bearish or bullish.
Leave it set to LongAndShort to trade in any direction.
Reverse Entry Direction?
When True, entry direction will be reversed for all trades (LONG instead of SHORT and SHORT instead of LONG). Very useful during choppy market times.
This section lets you configure how the strategy handles trade entries.
Position Sizing Method
You can either manually set your position sizing by using the QUANTITY method or have it set dynamically by using the CAPITAL TO RISK method by telling the strategy how much capital you wish to risk on your primary and secondary positions.
Primary Size
Set your primary trade size (quantity or capital to risk depending on position sizing method used above).
Secondary Size
Set your secondary trade size (quantity or capital to risk) to use for the Target 2 input specified below.. Set to 0 if you only wish to use fixed target 1.
Secondary Size Offset (ticks) [New in v5]
To trade your secondary size after a pullback, type a negative entry offset value. Or use a positive value to wait for continuation. Set to 0 to trade with Primary only.
Wait bars between trades
The strategy will wait this many bars after a trade is closed before entering a new one. This helps avoid over-trading in some trading modes and market conditions.
This section lets you configure how the strategy handles trade exits.
Target/Stop calculation method
You can decide to set your target 1/2 and stop with the TICK calculation method or PERCENTAGE. Tick is commonly used in Futures while Percentage mostly with Forex and Stock but you are welcomed to use any method you like on any markets.
Target 1
Set how many ticks/percentage away should the target be for Target 1
Target 2
Set how many ticks/percentage away should the target be for Target 2
Stop Loss
Set how many ticks/percentage away should the stop loss be for Target 1 and 2
Ticks to Breakeven
Tells the strategy to move the stop to breakeven after this many ticks. Set to 0 to disable.
Breakeven Offset
When the stop is moved to breakeven, tells the strategy to offset it by this many ticks. A positive value will place the stop in profit
Trail Floor (ticks)
After this many ticks in profit, the strategy will start trailing the stop order. Set to 0 to disable.
Trail By (ticks)
Once trailing is enabled, the strategy will trail the stop by this many ticks below the market price.
HiLo Trail Floor (ticks)
After this many ticks in profit, the strategy will start trailing the stop based on the HiLo indicator trendline. Set to 0 to disable.
This will let the strategy use the HiLo Indicator trendline to trail the stop order (if the parameter “Reverse Entry Direction” in the TRADING MODE section is enabled, then this parameter will be forced to FALSE as reversing entries makes HiLo trailing irrelevant). You can learn more about the HiLo indicator in the user manual HiLo indicator tab.
HiLo Trail Offset (ticks)
Used to define a positive or negative offset for trailing based on HiLo Indicator trendline.
For example, if set to -10, the stop will follow 10 ticks above the HiLo trendline in a bullish trend or 10 ticks below in a bearish trend. Try it out in market replay to see it play out in real-time.
SWING Trail floor (ticks) [New in v5]
After this many ticks in profit, the strategy will start trailing the stop based on the last plotted SWING . Set to 0 to disable.
SWING Trail Offset (ticks) [New in v5]
Define a positive or negate offset to trail the SWING indicator.
Use Ichimoku Exit
When true, the strategy will close active trades as soon as the Tenkan and Kijun crosses each other, from under or above (you can learn more about the ichimoku indicator in the user manual ichimoku tab)
Max trade duration [New in v5]
Specify the max trade duration allowed in bars. Set to 0 to disable.
The Swing indicator plots horizontal lines that represent the high and low swing points based on the “Strength” input value specified. In other words, this indicator represents potential support & resistance areas.
Strength
Indicate how many bars are required to constitute a Swing point. Use a small number to increase the pivot plotting frequency and use bigger number to only plot the major support and resistance levels.
Entry Offset
How many tick(s) above or below the last SWING the strategy will enter LONG or SHORT (a negative value can be used as well to enter trade before a support or resistance level is broken)
Min distance to change entry (ticks) [New in v5]
Minimum distance in ticks required between the current and newly plotted swing for the stop entry entry order to adjust itself. This input help you ignore newly plotted swings that are too close to the last one, thus keeping your stop at the major swing locations only.
Stop Limit Offset
Set to -1 to have the strategy use a Stop MARKET entry when the trade is triggered or use 0 or larger for a stop LIMIT entry. We recommend using a stop market entry to ensure the order is filled
SWING TRADER – 100% AUTOMATED TRADING MODE
The TRADOTO strategy leverages the Swing indicator as a fully automated trading mode by enabling the Use Swing Trader input.
The HiLo Indicator is a trend-following technical indicator used to reflect the market’s direction of movement and generate trend-following entry signals. The HiLo Indicator is a simple moving average of the previous three periods’ highs or lows, based on the moving averages logic.
The HiLo indicator appears in two different colors on the chart:
01. Use HiLo Trader
When ENABLED, the strategy will submit a market order as soon as the price enters the valid price range define using the inputs below. Please consult the Trading Mode section for more details.
02. Use HiLo Filtering?
When ENABLED, the strategy will use the HiLo indicator to filter trades by always trading in the direction of the trend and by respecting the inputs specified below. This lets you define precisely in which condition the strategy is allowed to take trades.
02a. HiLo Bar Delay
Set how many HiLo bars are required from the start of each new HiLo trend before the strategy is activated (minimum 1)
02b. HiLo Bar Limit
Set how many HiLo bars are required from the start of each new HiLo trend before the strategy is deactivated
03a. Min bars in previous trend
Set the minimum # of bars required in the previous HiLo trend to to keep the strategy activated in the current HiLo trend (useful to avoid choppy market)
03b. Max bars in previous trend
Set the maximum # of bars required in the previous HiLo trend to to keep the strategy activated in the current HiLo trend.
04a. Min ticks from HiLo
[New in v4 – Applies to HiLo Trader and HiLo Filtering]
Set how close to the HiLo you want the strategy to take trades. For example with a value of 5, you would be telling TRADOTO to not take any trade when the price is within 5 ticks of the HiLo trendline.
04b. Max ticks from HiLo
[New in v4 – Applies to HiLo Trader and HiLo Filtering]
Set how far to the HiLo you want the strategy to take trades. For example with a value of 30, you would be telling TRADOTO to not take any trade when the price is 30 ticks or more away from the HiLo trendline.
05. MA period
Used to alter the Moving Average period, default is 50.
06. Baseline Smoothing
Used to alter the Moving Average type for baseline, default is SMA (Simple Moving Average)
HILO TRADER – 100% AUTOMATED TRADING MODE
When the Use HiLo Trader input is checked, the strategy will let you trade fully automated within a price range zone plotted once per HiLo trend. TRADOTO will place a market order as soon as the bar closes within the valid price range zone pictured in green.
The valid price range is specified with Min and Max ticks from HiLo and HiLo Bar delay and Limit inputs and only when the previous HiLo trend-line had more or less bars than specified in the Min and Max bars in previous trend inputs.
GLOBAL TRADING FILTER
When the Use HiLo Filtering input is checked, the HiLo trading logic will filter all active trading modes.
The following logic will be enforced (see picture above for visual clarification):
ORDER STOP LOSS TRAILER
When the “Use HiLo Trail Stop” input is checked (located in the ORDER MANAGEMENT section), the strategy will trail the stop loss based on where the HiLo trendline is located.
The Ichimoku indicator is a versatile indicator that defines support and resistance, identifies trend direction, gauges momentum and provides trading signals. Even though the Ichimoku indicator may seem complicated when viewed on a chart, it is really a straightforward indicator after a little practice.
The Cloud (pictured in red and green below) is the most prominent feature of the Ichimoku indicator. There are two ways to identify the overall trend using the Cloud:
Traders will often use the cloud as an area of support and resistance depending on the relative location of the price. The cloud provides support levels that can be projected into the future. This sets the Ichimoku apart from many other technical indicators that only provide support and resistance levels for the current date and time.
01a. Use Ichimoku Cloud Break Trader
When true, the Ichimoku Cloud Break Trader conditions for a trade will take effect. See HOW TO USE IT section below for details
01b. Use Ichimoku T/K Cross Trader
When true, the Ichimoku Tenkan/Kijun Cross Trader conditions for a trade will take effect. See HOW TO USE IT section below for details
02. Use Ichimoku Filtering
When true, the strategy will use the Ichimoku indicator to filter all active trading modes. This lets you define precisely in which condition the strategy is allowed to take trades. Those conditions are:
03a. Tenkan Period
Tenkan-sen, or conversion line, creates a moving average of the highest and lowest prices over the past nine periods. It is used to present both support and resistance information. Leave the period value set to 9 (default) unless you wish to test a different variation of Ichimoku.
03b. Kijun Period
Kijun Line is the midpoint between the highest high and lowest low over a specified period of time. Leave the period value set to 26 (default) unless you wish to test a different variation of Ichimoku.
03c. Senkou B Period
The Senkou Span B lines is used to create the cloud of the Ichimoku indicator (combined with the Senkou A). Senkou Span B is used to give traders an idea of future support and resistance. Leave the period value set to 52 (default) unless you wish to test a different variation of Ichimoku.
03d. Senkou Shift
Number of bars to shift the cloud forward in the future. Leave the value set to 26 (default) unless you wish to test a different variation of Ichimoku.
CLOUD BREAK TRADER – 100% AUTOMATED TRADING MODE
TENKAN / KIJUN CROSS TRADER – 100% AUTOMATED TRADING MODE
GLOBAL TRADING FILTER
When the Use Ichimoku Filtering input is checked, the Ichimoku trading logic will filter all active trading modes.
The following logic will be enforced:
ORDER EXIT MANAGEMENT
When the “Use Ichimoku Exit” input is checked (located in the ORDER MANAGEMENT section), the strategy will close active trades as soon as the Tenkan and Kijun crosses each other, from under or above.
A pivot point is a popular intra-day technical indicator used to determine the overall trend of the market over different time frames. The pivot point itself (labeled PP in orange on the chart) is simply the average of the high, low and closing prices from the previous trading day. On the subsequent day, trading above the pivot point is thought to indicate ongoing bullish sentiment, while trading below the pivot point indicates bearish sentiment.
The pivot point (PP) is the basis for the indicator, but it also includes other support and resistance levels that are projected based on the pivot point (PP) calculation. All these levels help traders see where the price could experience support or resistance. Similarly, if the price moves through these levels it lets the trader know the price is trending in that direction.
Here is a quick recap
Pivot Range
Select the pivot range that is the best suited for your market.
HLC Calculation Mode
Leave default to “calcFromIntradayData” unless you have experience using other modes
Entry Offset (in Ticks)
Number of tick offset from pivot to take entry. You can use a positive or negative value here, use 0 to trade exactly at the pivot level.
Trade R3/2/1
Enable this to trade the Resistance levels based on the entry offset specified above
Trade PP
Enable this to trade the “Pivot Point” level based on the entry offset specified above
Trade S1/2/3
Enable this to trade the Support levels based on the entry offset specified above
CLOUD BREAK TRADER – 100% AUTOMATED TRADING MODE
TENKAN / KIJUN CROSS TRADER – 100% AUTOMATED TRADING MODE
GLOBAL TRADING FILTER
When the Use Ichimoku Filtering input is checked, the Ichimoku trading logic will filter all active trading modes.
The following logic will be enforced:
ORDER EXIT MANAGEMENT
When the “Use Ichimoku Exit” input is checked (located in the ORDER MANAGEMENT section), the strategy will close active trades as soon as the Tenkan and Kijun crosses each other, from under or above.
The Squeeze is the central concept of Bollinger Bands. Bollinger Bands are a highly popular technical analysis technique.
Many traders believe the closer the prices move to the upper band, the more overbought the market, and the closer the prices move to the lower band, the more oversold the market. When the bands come close together, constricting the moving average, it is called a squeeze.
A squeeze signals a period of low volatility and is considered by traders to be a potential sign of future increased volatility and possible trading opportunities.
01. Use Squeeze Filtering
When enabled, the strategy will trade only when the price action is in squeeze mode and also for X bar following the last squeeze as defined in the Squeeze Loop Back input below.
02a. Squeeze Loop Back
Tells the strategy to look back “X” amount of bars to see if a squeeze happened between the current price and the “X” number of bars away point (ie. 10 bar loopback, 5 bar loopback, etc.). If a squeeze is found, the strategy will keep itself enabled until the squeeze can no longer be found within that “X” bars range.
02b. Squeeze Min Bars [New in v4]
Define how many bars in squeeze mode are required for the strategy to acknowledge that the price action is in squeeze mode. This input helps reduce brief squeeze instance that last a very short time
03. ATR. StdDev Lenght
This lets you set the ATR and StdDev Lenght, leave default if you are not familiar with it
04. Bolinger Bands Std Devs from Average
This lets you set the Bolinger Bands Std Devs from Average, leave default if you are not familiar with it
05. Keltner Channel ATRs from Average
This lets you set the Keltner Channel ATRs from Average, leave default if you are not familiar with it
06. Momentum Period Length
This lets you set the Momentum Period Length, leave default if you are not familiar with it
07. Squeeze Style
Choose the squeeze style, we recommend leaving it to default “BBSqueeze” if you are not familiar with the different options
For example, if you set the loop back to 10, it will look up 10 bars back from the current price and let the strategy place trades if a squeeze is found within that range and stop all new trade after the squeeze is no longer detected. When set to zero, the strategy is turned off as soon as the squeeze ends.
GLOBAL TRADING FILTER
By enabling the Use Squeeze Filtering input, TRADOTO can take advantage of the Squeeze indicator with any automated trading mode by allowing trades to be taken only when the price action is in Squeeze mode or within a number of bars following a squeeze as specified in the “Squeeze Loop Back” input . When no squeeze are detected , the strategy is switched OFF until a squeeze appears again.
This section lets you configure how the strategy manages your daily unrealized and realized PnL combined.
01. Daily Target PnL
Stop trading after this much realized and unrealized profit is reached for the day (reset daily at the end of the day)
02. Daily Stop PnL
Stop trading after this much realized and unrealized loss (use a positive value) is reached for the day (reset daily at the end of the day) i.e. 400 = a loss of 400
03. Profit to Breakeven
After this much profit is reached, move stop PnL to breakeven
04. Breakeven Offset
When PnL is moved to breakeven, offset it by this much profit (for example, if set to 200, the strategy will disable itself and close all positions if the realized and unrealized profit combined reaches $200)
05. Profit to Trail
After this much realized and unrealized profit is reached, start trailing PnL. Set to a large value to disable
06. Trail Amount
Once trailing is enabled, trail PnL by this much profit (for example, if set to 400, the strategy will stop trading if the realized and unrealized profit combined drop by over $400)
This section lets you configure when the strategy will be active, which day of the week and what part of the day.
We provide 4 different time filters, meaning you could have the strategy start and end 4 different times on the same day. This is useful if you wish to avoid certain timeframe during the day. Say for example there is a major event scheduled on your traded instrument at 10AM daily, you want to have the strategy disabled at that time. To do that we will have to set two time filters to TRUE, the first active filter will be from the beginning of the day to say 9:55AM and the second time filter will be from 10:05AM to end of day.
You are welcome to swing trade using our strategy, an open position will not be closed at the end of the day if you have the TIME IN FORCE input set to GTC (Good ‘Til Canceled). Though, do keep in mind that the informative CLOSED PNL box in the lower left corner will reset to 0 daily at midnight.
Trade (DayOfTheWeek)
Specify which day of the week the strategy will be active
Use Time Filter?
Set to TRUE to enable a time range in which the strategy will be active
Trade Start Time
Specify the exact time the strategy will be enabled. Use this format HH:MM:SS
Trade End Time
Specify the exact time the strategy will be disabled. Use this format HH:MM
Close position at every end time [New in v4]
Tells the strategy to close open positions for every end time specified, useful to ensure that no trade are open between time filters.
Close position at latest end time [New in v4]
Tells the strategy to close open positions at the last end time specified, required to ensure that all trades are closed at the end of the trading session.
The Economic News Filtering & Trader let’s you trade precisely and safely huge volatile price action moves caused by scheduled market economic news events.
More details coming soon
Input series
Set your instrument to trade here. This will be set automatically based from which chart window you added the strategy
Add indicators to chart?
When ENABLED, the indicators that the strategy uses will be added to your chart. This feature is very useful when reviewing trades taken in theSTRAEGY ANALYZER window under the chart tab as this tab cannot use a custom chart template.
Sets the way that simulated historical orders will be processed by the strategy. See the Understanding Historical Fill Processing page for more information.
Exit on session close
When enabled, open positions will be closed on the last bar of a session
Exit on session close seconds
Sets the number of seconds prior to the end of a session at to close any open positions held by the strategy
Stop & Target submission
Sets how stop and target orders are submitted. Leave default unless familiar with those options
The time in force for an order defines the length of time over which an order will continue working before it is canceled
Time in force
Select either GTC or Day
DAY – A Day order is canceled if it does not execute by the close of the trading day. Unless otherwise specified, every order is a Day order.
GTC – A Good-Til-Canceled order will continue to work within the system and in the marketplace until it executes or is canceled.
This lower right corner button let you load and save strategy templates. very handy during optimization and when trading multiple instrument to quickly go back and forth between different configurations.
Please submit all support related inquiries by clicking the SUPPORT menu button in the upper right corner of this page
If we need to remote access your computer, we will have you click the button below to launch our remote access tool (no install required). Once the tool is running, please share the ID and Password displayed.
Most errors encountered by our members to date have been caused by their NT8 platform, we recommend doing a clean install to ensure the issue you are having isn’t caused by your local platform, listed below are the steps required to perform a clean install, please try that and create a support ticket if you are still having issues
Getting good results with our strategy? Coach others and earn money
Earn 30% for each trader you refer with your affiliate URL
Real-time sales/commissions tracking with instant email notifications
Payouts processed monthly via original payment method and PayPal
[affiliate_area_stats]
[affiliate_area_urls]
[affiliate_registration]
[affiliate_area_visits]
[affiliate_area_referrals]
[affiliate_area_creatives]
[affiliate_area_settings]
[affiliate_area_payouts]
Download the latest NT8 version and install it using the default settings.
We require your Ninja Trader MachineID in order to enable your use of the TRADOTO strategy that you purchased from us. Use the form below to submit it.
That information can be found from the Help > About menu in NinjaTrader. It is a string of 32 alphanumeric characters, with no dashes. Please be sure that you do not submit your NinjaTrader License ID.
The TRADOTO strategy can be licensed and used on one machines. If you plan to upgrade your computer hardware or replace it with a new one, you must resubmit your new MachineID to us before the strategy can be used again.
If you need to run TRADOTO on two platforms simultaneously, you can add a second machine ID to your account by purchasing it HERE
You can download the latest version of TRADOTO and review our strategy change log below. We also email all active members every time we release a new version.
Version 5.0 (New - April 2020)
NEW TRADING MODE
– New trading mode leveraging the popular Pivot indicator. You can now trade your favorite support and resistance pivots levels fully automated with our fully featured order management Algorithm, enjoy!
NEW FEATURE
– Revamped strategy layout to speed up learning curve and facilitate optimization
– You can now enter on pullback with a pre defined offset to optimize your entry price event more!
– New input to let you ignore cloud position in relation to price to increase trading flexibility when using the Ichimoku trading mode
– You can now trail your stop based on the last support or resistance level!
– Added new input to avoid entry on choppy price action when using the swing trading mode
– New algorithm to close a partially filled entry position when STOP/TARGET is hit to avoid having a re-entry on the remaining unfilled position.
– Added new input to bypass T/K alignment when using the Cloud Break Trader
– HiLo trader filtering input can now be applied globally to all trading modes
– Swing entry offset can now be used with a negative value to place trades before support or resistance levels are broken
– Improved fill accuracy with TopStepTrader pre-funded accounts
Version 4.0
NEW TRADING MODE
– Introducing two brand new trading modes leveraging the Ichimoku indicator, see user manual for all the details.
NEW FEATURE
– New and improved strategy control panel layout
– Brand new trading mode to leverage the popular ichimoku indicator
– New input to let you trade in one direction, short or long. This can be helpful in some markets where you see that the daily chart is extremely bearish or bullish.
– New merged trading execution mode to let you see historical trades while trading LIVE
– You can now specify your position sizing in quantity or “Capital to risk” to let TRADOTO dynamically calculate the number of contract/shares to buy depending on the capital entered.
– You like to use percentage to calculate how far your target an stop should be? you can now do that thanks to the “Target/Stop calculation method” input.
– Added input to pause the strategy X number of bars between trades to avoid over-trading when using lower timeframes.
– You can now define the minimum squeeze duration before the strategy is turned on.
– Added input to either close position at the last time filter only or all the time even between time filters.
– New order exit method leveraging the Ichimoku indicator for improved trailing method.
– HiLo trader filtering input can now be applied globally to all trading modes
– Swing entry offset can now be used with a negative value to place trades before support or resistance levels are broken
– v4.0.1.6: Added new input to bypass T/K alignment when using the Cloud Break Trader
– v4.0.1.14: Implement new algorithm to close a partially filled entry position when STOP/TARGET is hit to avoid having a re-entry on the remaining unfilled position.
BUGFIX
– v4.0.1.5: Fix input naming typo and resolve minor conflict when combining the hilo filtering with itchimoku
– v4.0.1.6: Fix HiLo filtering conflict when used with other trading indicator modes
– v4.0.1.9: Fix historical trading engine inaccuracy with stops and tailing caused by the latest NT platform version update.
– v4.0.1.12: Improve partial fills handling when using stop limit entries
– v4.0.1.14: Resolve error when enabling news filter
– v4.0.1.16: Resolve PnL sync issue with TopStepTrader Data feed
Version 3.0.1.15
NEW FEATURE
– Added Squeeze box to the chart in order to easily visualize when the market is in squeeze (default when using the TRADOTO template)
– Added new ROLLOVER indicator: Shows a button on the chart in the upper right corner to roll the instrument to the front month (default when using the TRADOTO template)
– Added market economic news filters to easily cancel trading when the market is volatile
– Added a new “Economic News Filtering” trading mode to trade market economic news events
– Added input to leave open position open when the end time filter is reached to let ongoing trade close via STOP or TARGET
– Added input to pause the strategy when a trade ended using HiLo trader to avoid overtrading situations if the price stays within the entry zone for too long
BUGFIX
– Optimizes the order management engine to improve speed and accuracy when working with high volatility markets.
– Recode how the order management handles stops distance to allow the stop to be placed closer to the entry point (useful when trading forex)
Version 2.1.0.2
NEW FEATURE
– Added info message next to PnL counter in lower left corner when daily max profit/loss is reached: “Daily Limit reached – trading stopped”
– Added pop up error message when disabling strategy with open position: “Strategy disabled with open position – check your position to be sure it is as you desire”
– Added pop up error message when strategy is unable to fill an order due to a platform or brokerage problem: “Strategy stopped due to rejected entry order – verify that you are flat”
BUGFIX
– Error handling engine has been revised from [cancel everything & close position] to only ignore errors as this was introducing conflicts with the platform default error handling actions.
– Resolved issue where a time filter or stop order was rejected resulting in open positions
Version 2.1.0.1
NEW FEATURE
– A brand new trading mode is being introduced called HiLo Trader. It allows the strategy to trade of HiLo Crossovers. More details can be found in the User Manual.
– Indicators can now be plotted on the chart while using the Strategy Analyzer window by enabling the “Add indicators to chart?” under the DATA SERIES section.
– The control panel layout has been revamped to bring the most accessed section to the top.
BUGFIX
– We’ve resovled a bug that was causing the strategy to crash by trying to submit an order in historical mode instead of real-time while connected to SIM.
Version 2.0.14.0
BUGFIX
– NinjaTrader version 8.0.5.2 introduces new codes for order management on strategies. We’ve included those new languages to be fully compatible with this latest release
Version 2.0.10.0
NEW FEATURE
– Strategy Analyzer back-testing reliability has been improved in the latest version of Ninjatrader 8.0.5.2, our strategy code has now been updated to fully take advantage of this tool (see STRATEGY OPTIMIZATION tab for more details)
BUGFIX
– Resolve a bug where the strategy was trying to cancel an order already pending cancellation.
– Fixed a HiLo indicator sound alert option that wasn’t working.
Version 2.0.8.0
NEW FEATURE
– Improved layout to speed up enabling and disabling the strategy from the chart. The most useful sections are now pinned to the top and least useful ones moved to the bottom. Please review the user manual for clarification.
BUGFIX
– Resolve an issue where the breakeven PnL feature would be stuck in a loop
– Enabling the squeeze indicator was preventing the strategy from running
Version 2.0.6.0
NEW FEATURE
– Automatically close active and pending trades after the platform loses connection to the exchange and reconnect. To enable this new feature, be sure to enable the KEEP RUNNING handling feature as detailed on the CHANGE OPTIONS starting guide tab.
BUGFIX
– Resolve intermittent issue where a position is left without stop loss and targets.
– Correct Closed PnL syncing issue when a trade is closed after reaching time filter end time.
Version 2.0
NINJATRADER 8
Our strategy is now compatible with NinjaTrader 8.
STRATEGY TEMPLATES
This was our most requested feature, the ability to save and load templates to speed up the optimization process, we’ve now added support for templates, enjoy!
OPPOSITE MODE
We were seeing a lot of trading opportunities where taking reversal trades was very profitable in certain trading hours and with the right offset for entry. This feature will let the strategy place a LONG trade where it would usually go SHORT or go SHORT where a LONG would occur.
REAL TIME PNL MONITORING
Previously the STOP and TARGET PnL was acting only on the realized PnL (closed trades), this often made the strategy go beyond the max loss/profit on the day by ignoring ongoing/unrealized trades. Starting in version 2, the PnL management will be done in real time by actively monitoring the unrealized PnL as well.
PNL BREAK EVEN & TRAILING
This new feature adds break end and trailing to the daily target PnL as soon as the combined unrealized/realized target PnL is reached on the day. This will avoid being in the green at the start of the day but ending the day in the red.
Version 1.0
This is the only version compatible with NinjaTrader 7. If you would rather use our strategy on NT7, please follow the V1 Starting Guide and review the V1 User Manual linked below. We still provide BUGFIX support for version 1 but new features are only added for the NT8 platform going forward as the coding is drastically different between NT7 and NT8..
Follow the steps pictured below to import your strategy ZIP file, after step 3 pictured below, find the TRADOTO ZIP file and open it to start the import process. After the import complete, restart the NinjaTrader platform
If you are upgrading to a newer version of our strategy, you might encounter this error upon importing the strategy.
To avoid this problem, ensure you have removed any strategy added on charts or from the strategy tab. Then follow the steps below:
If the import is still failing after removing the NinjaScript Assembly as shown above, please manually remove the strategy files as follow.
Lastly, if both solutions above didn’t help, please perform a NT8 factory reset as shown below:
Next let’s add your data provider/broker connection so the platform can connect to the exchange and receive market data. if you haven’t signed up with on, you can review compatible brokers on this page http://ninjatraderecosystem.com/Brokers.php
Your broker will provide you the configuration details. For your reference, here is how the Ninja CQG provider connection is added: http://ninjatrader.com/ConnectionGuides/CQG-Connection-Guide
NinjaTrader offers FREE live futures data (not delayed) for SIM trading by signing up HERE. The connection expires after a few weeks, at which point you can renew again from the same page and using the same email address or fund a real account to use a permanent connection to the exchange.
Setup your chart and instrument by following the steps below.
If you are trading futures, be sure to rollover your instruments on the expiration date. See 2nd picture below for more details on how this is done in NinjaTrader 8
TIP: to delete instrument from the instrument list after adding from the lookup tool, simply highlight it on the list and press DEL on your keyboard
Once your machine ID has been submitted and registered, you can enable the strategy using two different approaches, both pictured below. Method 1 is done from the chart and method 2 from the control center strategy tab
Please note that with method 2 it will not display the closed pnl counter in lower left corner on the chart.
Pictured below is how the TRADOTO strategy is enabled on the chart, be sure to make changes to it or disabled it from the chart as well by disabling the strategy first and clicking APPLY. Mixing Method 1 and method 2 (shown below) could produce platform issues, always use the same method.
Please only enable one strategy per chart. Simply open a new chart window to trade additional instruments
Once your strategy has been enabled from the strategy tab as pictured below, be sure to make changes to it or disabled it from the strategy tab as well. Mixing Method 1 and 2 could result in some platform issues, always use the same method.
The best way to quickly assimilate what each input in our strategy does, is to setup a workspace with a monitor dedicated to the TRADOTO User Manual and the secondary monitor for your favorite chart instrument with a few days of historical data to play with. (you can increase the number of days loaded on the chart by right clicking on an empty spot on the chart > DATA SERIES > DAYS TO LOAD)
With this workspace, you’ll be able to quickly study each input and how they impact trading result by flipping the strategy ON/OFF after making minor adjustment. The changes you make will reflect instantly on the chart by showing you where the entry and exit would have been taken (as pictured below). A good exercise is to analyze the trade taken on the chart and improve them by slowly altering each inputs until the day is very profitable, this helps build a very strong understanding on how our strategy works. Be sure to practice with all TRADING MODE we offer so you can then focus your OPTIMIZATION phase with your favorite exclusively (more details on the this phase is found in the BACKTEST OPTIMIZATION tab after)
After playing with historical data, we advise taking it to the next level by running your configuration in REPLAY MARKET to see the trade enfold in REAL TIME, this is more time consuming but very eye-opening so be sure to spend time on that as well. You can learn more about MARKET REPLAY in the next tabs.
Before using our strategy on the LIVE market, it is required to find your optimal strategy configuration using BACKTEST.
Optimizing your strategy means going over multiple weeks/months of market price action to see how a strategy configuration performs longer term. Before optimizing, be sure to fully understand all the strategy parameters covered in the user manual. Once this all make sense, you’ll want to start testing several configuration iterations using BACKTEST in the strategy analyzer window.
The first step to determine the validity of a trading idea is to backtest your configuration versus historical market data. Backtesting helps you identify quickly a potentially effective strategy configuration and serves as a starting point. Backtesting provides a bird’s eye view of how your strategy configuration may perform in a real-time trading environment. Testing various configurations and observing their results is an excellent way to get started and get different ideas brewing.
Backtest results generated with our strategy are accurately representating live trading trades, keep in mind that minor differences can be found from time to time as backtest works with 4 data points per candle (OHLC: Open/High/Low/Close) while real-time trading provides a tick by tick data feed which is way more detailed than backtest. For the closest profit representation, we recommend using the market replay mode, visit the market replay optimization tab for more details on this step. If you are seeing a lot of different result between your LIVE and BACKTEST trade, make sure that you are using the HIGH FILL RESOLUTION mode (not STANDARD) at the bottom of the tradoto control panel as this will ensure the NinjaTrader trading engine is provided with the most historical price action details, more details on this feature here.
In this two videos, we will go over how the strategy analyzer tool works and how backtest optimization is performed with our strategy. For more details on the Strategy Analyzer tool, you can consult the official NT manual as well.
Our backtest templates for futures are useful to speed up your learning curve using the strategy analyzer but aren’t meant to be used as is on your LIVE trading account, further optimization will be required to match your trading style, account size and risk tolerance. All template deliver reliable and constant historical return over at least a 6 months trading history. Each template helps our member visualize different profitable configuration that uses various trading style, bar type, trading hours, etc…
To use our template, simply launch the Strategy Analyzer and follow the numbered steps below
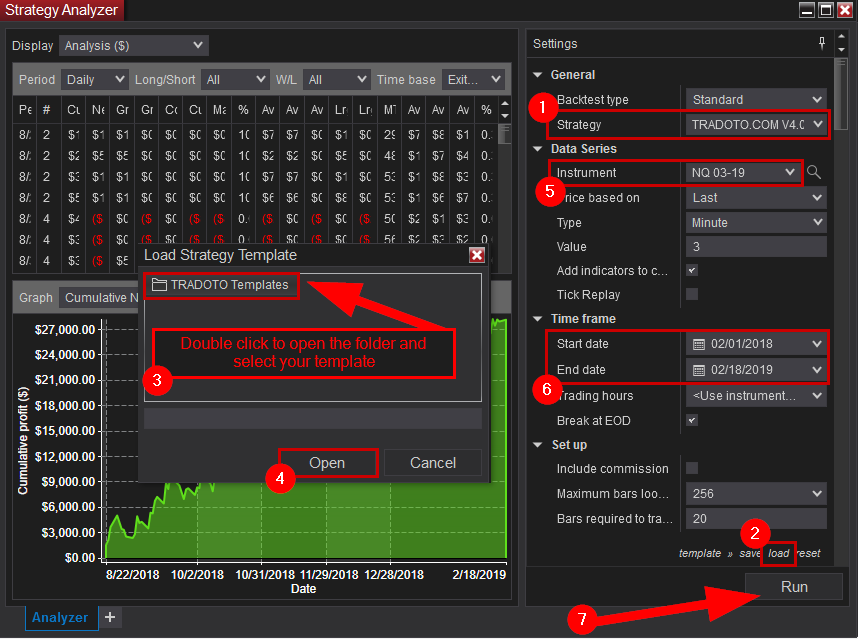
1. Select our Strategy from the dropdown menu: TRADOTO.COM
2. Click TEMPLATE at the bottom of the strategy panel and select LOAD
3. Double click the “TRADOTO Templates” folder and select a template to try
4. Click OPEN
5. Select the latest contract month instrument (aka front month) used in the template you selected. To be sure you are using the latest one, click the LOOKUP icon beside the instrument drop down, search for the instrument and select it, the platform will always grab the latest front month that way.
6. Set your desired start and end date to backtest, keep in mind that most historical data provider only offer a year worth of tick data.
7. Ensure you are connected to your broker to retrieve the historical data needed to generate this report and then click RUN (running a backtest while being disconnected or connected to a data feed without historical data like playback or EOD data will not work)
8. (not pictured) Our template are created from on the Eastern Standard time zone (EST). You will have to either set your operating system time zone to that (NY Time) or adjust the start and end time filter inputs in the strategy to match your own local time zone.
For example, using 1 contract with a stop distance of 20 ticks or 2 contract with a stop of 10 ticks will cost you $200 per bad trade when trading Crude Oil which cost $10 per tick, in that case set your max daily loss to -400 to allow two bad trade in a row at least.
Once a profitable configuration is found through backtesting, expanding testing to MARKET REPLAY will help validate your results in a real time simulated environment.
Market Replay is the ability to replay market data it as if it was happening in real-time. You can trade in simulation against this data at varying levels of replay speed. This feature bring the most accuracy in strategy results, it is the best way to confirm that your strategy configuration (optimized in backtest) is working as expected.
The video below will walk you through how this feature works in NinjaTrader.
We strongly advise to setup text notification alerts on your phone to be alerted immediately when an error occurs on your platform, this is crucial to have when away from the computer!
Below is a list of known e-mail provider settings demonstrating e-mail alerts configuration within NinjaTrader.
For step 7 pictured below, you’ll need to enter your personal email provider server settings, if your domain configuration isn’t listed under the picture, please research online what you should be using for your own email server.
Lastly in Step 7, the EMAIL ADDRESS field should be your phone carrier text messaging email address in order to receive alerts directly on your phone via SMS, if you unsure what it is, please research online or call your phone carrier to ask them (this should be the format: yourphonenumber@yourcarrierdomainname)
AOL:
Please note the user name may or may not contain “@aol.com”.
Server: smtp.aol.com
Port: 587
SSL: Enabled
User: “YourUserName” or “YourUserName@aol” Note: New accounts require “@aol.com” in username.
Password” “YourPassword”
GMAIL:
Please note the user name does NOT contain the “@gmail.com”.
Server: smtp.gmail.com
Port: 587
SSL: Enabled
User: “YourUserName”
Password” “YourPassword”
HOTMAIL:
Please note the user name contains the “@hotmail.com”.
Server: smtp.live.com
Port: 587
SSL: Enabled
User: “YourUserName@hotmail.com”
Password” “YourPassword”
YAHOO:
Please note the user name does NOT contain the “@yahoo.com”. Also you must enable ‘POP’ within your email account as shown HERE
Note: Yahoo may require a paid account for utilization of the SMTP/POP services.
Server: smtp.mail.yahoo.com
Port: 587
SSL: Enabled
User: “YourUserName”
Password “YourPassword”
Once your mail setup is complete, please test your configuration as pictured below to ensure you are receiving SMS alert on your phone. Simply set the HiLo Activator and the SWING indicator to FALSE, then enable the strategy to trigger the error pictured, an SMS alert will be sent to your phone within the next 10 seconds.
Automated trading strategies leave pending orders on your broker servers waiting to be filled. When the internet connection goes down where the strategy is running, the pending order is left running on the broker side unattended, this means that if the price action hit that order, the platform running the strategy won’t be online to submit the usual stop and limit orders to manage the active trade.
For this reason, you must be aware when the internet goes down so you can promptly cancel any pending order left on the broker end and reconnect your strategy when the internet is back up
There are many websites that offer monitoring services, to start monitoring your home internet connection, you must ensure you have a STATIC IP address, then you can enable monitoring using a site like this one http://uptimerobot.com/ (to receive SMS alert instead of email, simply set the primary email to the same email address used in the MOBILE SMS TEXT NOTIFICATION tab above, that email will relay new emails to your phone number directly)
Another option is to setup your platform on a trading Virtual Private Server (aka VPS). Those dedicated server are hosted offsite close to the exchange for faster fill and will have a static IP address. You can then use their server static IP address with your monitoring site. Here is NinjaTrader recommended VPS provider http://www.ninjatraderbrokerage.com/hosting_services
To ensure the strategy can cancel all pending and active orders In case your platform loses internet access, we need to advise the NinjaTrader 8 platform to leave the strategy running when the platform loses and restore internet access. Please follow the step below to do so:
Also we recommend to Uncheck the “confirm order placement” option as pictured below to avoid the repetitive warning pop up every time the strategy is turned on:
Most markets become highly volatile when important news event surface. It is highly recommended that you anticipate when those events occur to either turn off the strategy in order to avoid slippage or customize it to maximize profits and safety.
Here is a list of popular economic calendar sites, some even offer mobile application to receive alerts on your smart phone (filter the importance of the news to only show medium and high events and focus only on the instrument you are trading of course).
By default, your computer will go into sleep mode after a period of inactivity. in order for TradOTO to run 24/7 your computer must remain powered on all the time, watch this video to learn how this is done on a Windows 10 computer:
After a few months of LIVE trading with great results, we recommend migrating your platform in the cloud for greater reliability/uptime and reduce your slippage with a server located closer to the exchange.
This cloud hosted server solution also lets you easily remote access your TRADOTO platform from anywhere, even your phone.
We advise to setup your VPS with the Windows Server 2012 operating system (version 2019 will require more ressources to run at similar speed), at least 3GB RAM and a CPU with 2 cores. Our recommended VPS provider is VPSSERVER which offers those hardware specifications for as low as $29.99/m, you can sign up for a 7 day free trial using the button below.
Account
Sets the account for which the strategy will trade against, make sure this match your active connection, Sim, Replay or Live
Calculate
Dictate when the indicators values are calculated, either on bar close, on each tick or on price change. Please leave default with ON BAR CLOSE if you haven’t used other settings in the past.
Label
leave default
Maximum bars look back
Max number of bars used for calculating indicator/internal series values. 256 setting is the most memory friendly.
Min. bars required
Set the minimum bars required for the strategy to calculate, We recommend leaving this default at 20
Start behavior
Leave default with WAIT UNTIL FLAT is recommended, learn more about each option here
Enable
Turn the strategy ON and OFF
This section lets you configure how the strategy handles trades
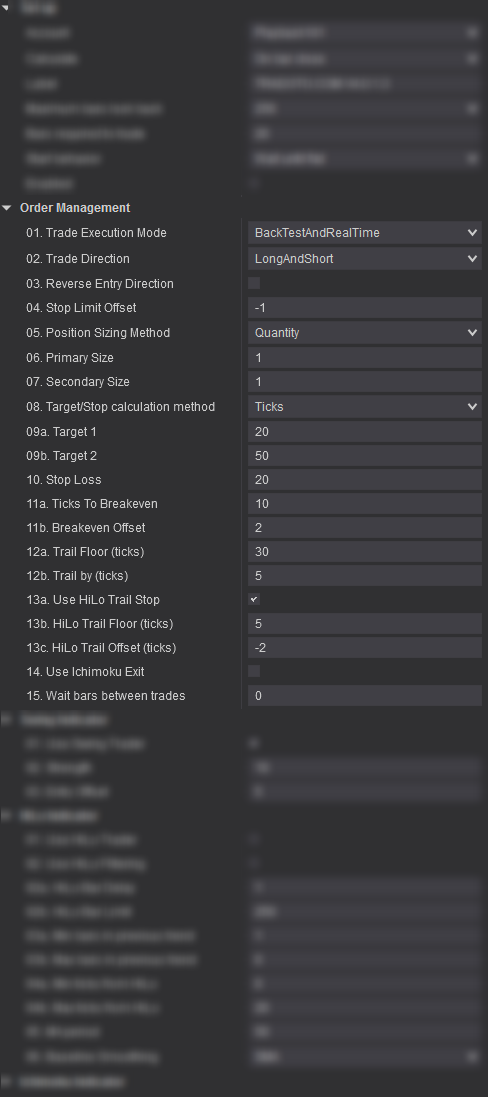
01. Trade Execution Mode [New in v4]
This input let’s you switch between different strategy execution mode.
02. Trade Direction [New in v4]
This input allows you to only trade in one direction, short or long. This can be helpful in some markets where you see that the daily chart is extremely bearish or bullish.
Leave it set to LongAndShort to trade in any direction.
03. Reverse Entry Direction?
When True, entry direction will be reversed for all trades (LONG instead of SHORT and SHORT instead of LONG). Very useful during choppy market times.
04. Stop Limit Offset
Set to -1 to have the strategy use a Stop MARKET entry when the trade is triggered or use 0 or larger for a stop LIMIT entry
We recommend using a stop market entry to ensure the order is filled
05. Position Sizing Method [New in v4]
You can either manually set your position sizing by using the QUANTITY method or have it set dynamically by using the CAPITAL TO RISK method by telling the strategy how much capital you wish to risk on your primary and secondary positions.
06. Primary Size
Set your primary trade size (quantity or capital to risk) to use for the Target 1 input specified below.
07. Secondary Size
Set your secondary trade size (quantity or capital to risk) to use for the Target 2 input specified below.. Set to 0 if you only wish to use fixed target 1.
08. Target/Stop calculation method [New in v4]
You can decide to set your target 1/2 and stop by using the TICK calculation or PERCENTAGE. Tick is commonly used in Futures while Percentage mostly with Forex and Stock but you are welcomed to use any method on any markets.
09a. Target 1
Set how many ticks/percentage away should the target be for Target 1
09b. Target 2
Set how many ticks/percentage away should the target be for Target 2
10. Stop Loss
Set how many ticks/percentage away should the stop loss be for Target 1 and 2
11a. Ticks to Breakeven
Tells the strategy to move the stop to breakeven after this many ticks. Set to a large value to disable it.
11b. Breakeven Offset
When the stop is moved to breakeven, tells the strategy to offset it by this many ticks. A positive value will place the stop in profit
12a. Trail Floor (ticks)
After this many ticks in profit, the strategy will start trailing the stop order. Set to a large value to disable
12b. Trail By (ticks)
Once trailing is enabled, the strategy will trail the stop by this many ticks below the market price.
13a Use HiLo Trail Stop
If set to true, the strategy will use the HiLo Indicator trendline to trail the stop order (if the parameter “02. Reverse Entry Direction?” is set to TRUE, this parameter will be forced to FALSE as reversing entries makes HiLo trailing irrelevant). You can learn more about the HiLo indicator in the user manual HiLo tab.
13b. Ticks to Trail
After this many ticks in profit, the strategy will start trailing the stop based on the HiLo indicator trendline. Set to a large value to disable
13c Use HiLo Trail Offset
Used to define a positive or negative offset for trailing based on HiLo Indicator trendline.
For example, if set to -10, the stop will follow 10 ticks above the HiLo trendline in a bullish trend or 10 ticks below in a bearish trend. Try it out in market replay to see it play out in real-time.
14. Use Ichimoku Exit [New in v4]
When true, the strategy will close active trades as soon as the Tenkan and Kijun crosses each other, from under or above (you can learn more about the ichimoku indicator in the user manual ichimoku tab)
15. Wait bars between trades [New in v4]
The strategy will wait this many bars after a trade is closed before entering a new one. This helps avoid over-trading in some trading modes and market conditions.
The Swing indicator plots horizontal lines that represent the high and low swing points based on the “Strength” input value specified. In other words, this indicator represents potential support & resistance areas.
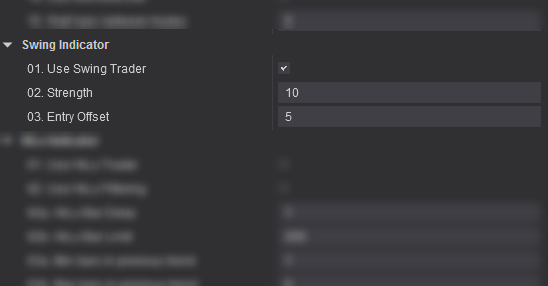 01. Use Swing Trader
When ENABLED, the strategy will enter the market based on support and resistance pivot levels and the offset specified below. Please consult the Trading Mode section on the User Manual Page for more details.
02. Strength
Indicate how many bars are required to constitute a Swing point. Use a small number to increase the pivot plotting frequency and use bigger number to only plot the major support and resistance levels.
03. Entry Offset
How many tick(s) above or below the last SWING the strategy will enter LONG or SHORT (a negative value can be used as well to enter trade before a support or resistance level is broken)
SWING TRADER – 100% AUTOMATED TRADING MODE
The TRADOTO strategy leverages the Swing indicator as a fully automated trading mode by enabling the Use Swing Trader input.
The HiLo Indicator is a trend-following technical indicator used to reflect the market’s direction of movement and generate trend-following entry signals. The HiLo Indicator is a simple moving average of the previous three periods’ highs or lows, based on the moving averages logic.
The HiLo indicator appears in two different colors on the chart:
01. Use HiLo Trader
When ENABLED, the strategy will submit a market order as soon as the price enters the valid price range define using the inputs below. Please consult the Trading Mode section for more details.
02. Use HiLo Filtering?
When ENABLED, the strategy will use the HiLo indicator to filter trades by always trading in the direction of the trend and by respecting the inputs specified below. This lets you define precisely in which condition the strategy is allowed to take trades.
02a. HiLo Bar Delay
Set how many HiLo bars are required from the start of each new HiLo trend before the strategy is activated (minimum 1)
02b. HiLo Bar Limit
Set how many HiLo bars are required from the start of each new HiLo trend before the strategy is deactivated
03a. Min bars in previous trend
Set the minimum # of bars required in the previous HiLo trend to to keep the strategy activated in the current HiLo trend (useful to avoid choppy market)
03b. Max bars in previous trend
Set the maximum # of bars required in the previous HiLo trend to to keep the strategy activated in the current HiLo trend.
04a. Min ticks from HiLo
[New in v4 – Applies to HiLo Trader and HiLo Filtering]
Set how close to the HiLo you want the strategy to take trades. For example with a value of 5, you would be telling TRADOTO to not take any trade when the price is within 5 ticks of the HiLo trendline.
04b. Max ticks from HiLo
[New in v4 – Applies to HiLo Trader and HiLo Filtering]
Set how far to the HiLo you want the strategy to take trades. For example with a value of 30, you would be telling TRADOTO to not take any trade when the price is 30 ticks or more away from the HiLo trendline.
05. MA period
Used to alter the Moving Average period, default is 50.
06. Baseline Smoothing
Used to alter the Moving Average type for baseline, default is SMA (Simple Moving Average)
HILO TRADER – 100% AUTOMATED TRADING MODE
When the Use HiLo Trader input is checked, the strategy will let you trade fully automated within a price range zone plotted once per HiLo trend. TRADOTO will place a market order as soon as the bar closes within the valid price range zone pictured in green.
The valid price range is specified with Min and Max ticks from HiLo and HiLo Bar delay and Limit inputs and only when the previous HiLo trend-line had more or less bars than specified in the Min and Max bars in previous trend inputs.
GLOBAL TRADING FILTER
When the Use HiLo Filtering input is checked, the HiLo trading logic will filter all active trading modes.
The following logic will be enforced (see picture above for visual clarification):
ORDER STOP LOSS TRAILER
When the “Use HiLo Trail Stop” input is checked (located in the ORDER MANAGEMENT section), the strategy will trail the stop loss based on where the HiLo trendline is located.
The Ichimoku indicator is a versatile indicator that defines support and resistance, identifies trend direction, gauges momentum and provides trading signals. Even though the Ichimoku indicator may seem complicated when viewed on a chart, it is really a straightforward indicator after a little practice.
The Cloud (pictured in red and green below) is the most prominent feature of the Ichimoku indicator. There are two ways to identify the overall trend using the Cloud:
Traders will often use the cloud as an area of support and resistance depending on the relative location of the price. The cloud provides support levels that can be projected into the future. This sets the Ichimoku apart from many other technical indicators that only provide support and resistance levels for the current date and time.
01a. Use Ichimoku Cloud Break Trader
When true, the Ichimoku Cloud Break Trader conditions for a trade will take effect. See HOW TO USE IT section below for details
01b. Use Ichimoku T/K Cross Trader
When true, the Ichimoku Tenkan/Kijun Cross Trader conditions for a trade will take effect. See HOW TO USE IT section below for details
02. Use Ichimoku Filtering
When true, the strategy will use the Ichimoku indicator to filter all active trading modes. This lets you define precisely in which condition the strategy is allowed to take trades. Those conditions are:
03a. Tenkan Period
Tenkan-sen, or conversion line, creates a moving average of the highest and lowest prices over the past nine periods. It is used to present both support and resistance information. Leave the period value set to 9 (default) unless you wish to test a different variation of Ichimoku.
03b. Kijun Period
Kijun Line is the midpoint between the highest high and lowest low over a specified period of time. Leave the period value set to 26 (default) unless you wish to test a different variation of Ichimoku.
03c. Senkou B Period
The Senkou Span B lines is used to create the cloud of the Ichimoku indicator (combined with the Senkou A). Senkou Span B is used to give traders an idea of future support and resistance. Leave the period value set to 52 (default) unless you wish to test a different variation of Ichimoku.
03d. Senkou Shift
Number of bars to shift the cloud forward in the future. Leave the value set to 26 (default) unless you wish to test a different variation of Ichimoku.
CLOUD BREAK TRADER – 100% AUTOMATED TRADING MODE
TENKAN / KIJUN CROSS TRADER – 100% AUTOMATED TRADING MODE
GLOBAL TRADING FILTER
When the Use Ichimoku Filtering input is checked, the Ichimoku trading logic will filter all active trading modes.
The following logic will be enforced:
ORDER EXIT MANAGEMENT
When the “Use Ichimoku Exit” input is checked (located in the ORDER MANAGEMENT section), the strategy will close active trades as soon as the Tenkan and Kijun crosses each other, from under or above.
A pivot point is a popular intra-day technical indicator used to determine the overall trend of the market over different time frames. The pivot point itself (labeled PP in orange on the chart) is simply the average of the high, low and closing prices from the previous trading day. On the subsequent day, trading above the pivot point is thought to indicate ongoing bullish sentiment, while trading below the pivot point indicates bearish sentiment.
The pivot point (PP) is the basis for the indicator, but it also includes other support and resistance levels that are projected based on the pivot point (PP) calculation. All these levels help traders see where the price could experience support or resistance. Similarly, if the price moves through these levels it lets the trader know the price is trending in that direction.
Here is a quick recap
01a. Use Ichimoku Cloud Break Trader
When true, the Ichimoku Cloud Break Trader conditions for a trade will take effect. See HOW TO USE IT section below for details
01b. Use Ichimoku T/K Cross Trader
When true, the Ichimoku Tenkan/Kijun Cross Trader conditions for a trade will take effect. See HOW TO USE IT section below for details
02. Use Ichimoku Filtering
When true, the strategy will use the Ichimoku indicator to filter all active trading modes. This lets you define precisely in which condition the strategy is allowed to take trades. Those conditions are:
03a. Tenkan Period
Tenkan-sen, or conversion line, creates a moving average of the highest and lowest prices over the past nine periods. It is used to present both support and resistance information. Leave the period value set to 9 (default) unless you wish to test a different variation of Ichimoku.
03b. Kijun Period
Kijun Line is the midpoint between the highest high and lowest low over a specified period of time. Leave the period value set to 26 (default) unless you wish to test a different variation of Ichimoku.
03c. Senkou B Period
The Senkou Span B lines is used to create the cloud of the Ichimoku indicator (combined with the Senkou A). Senkou Span B is used to give traders an idea of future support and resistance. Leave the period value set to 52 (default) unless you wish to test a different variation of Ichimoku.
03d. Senkou Shift
Number of bars to shift the cloud forward in the future. Leave the value set to 26 (default) unless you wish to test a different variation of Ichimoku.
CLOUD BREAK TRADER – 100% AUTOMATED TRADING MODE
TENKAN / KIJUN CROSS TRADER – 100% AUTOMATED TRADING MODE
GLOBAL TRADING FILTER
When the Use Ichimoku Filtering input is checked, the Ichimoku trading logic will filter all active trading modes.
The following logic will be enforced:
ORDER EXIT MANAGEMENT
When the “Use Ichimoku Exit” input is checked (located in the ORDER MANAGEMENT section), the strategy will close active trades as soon as the Tenkan and Kijun crosses each other, from under or above.
The Squeeze is the central concept of Bollinger Bands. Bollinger Bands are a highly popular technical analysis technique.
Many traders believe the closer the prices move to the upper band, the more overbought the market, and the closer the prices move to the lower band, the more oversold the market. When the bands come close together, constricting the moving average, it is called a squeeze.
A squeeze signals a period of low volatility and is considered by traders to be a potential sign of future increased volatility and possible trading opportunities.
01. Use Squeeze Filtering
When enabled, the strategy will trade only when the price action is in squeeze mode and also for X bar following the last squeeze as defined in the Squeeze Loop Back input below.
02a. Squeeze Loop Back
Tells the strategy to look back “X” amount of bars to see if a squeeze happened between the current price and the “X” number of bars away point (ie. 10 bar loopback, 5 bar loopback, etc.). If a squeeze is found, the strategy will keep itself enabled until the squeeze can no longer be found within that “X” bars range.
02b. Squeeze Min Bars [New in v4]
Define how many bars in squeeze mode are required for the strategy to acknowledge that the price action is in squeeze mode. This input helps reduce brief squeeze instance that last a very short time
03. ATR. StdDev Lenght
This lets you set the ATR and StdDev Lenght, leave default if you are not familiar with it
04. Bolinger Bands Std Devs from Average
This lets you set the Bolinger Bands Std Devs from Average, leave default if you are not familiar with it
05. Keltner Channel ATRs from Average
This lets you set the Keltner Channel ATRs from Average, leave default if you are not familiar with it
06. Momentum Period Length
This lets you set the Momentum Period Length, leave default if you are not familiar with it
07. Squeeze Style
Choose the squeeze style, we recommend leaving it to default “BBSqueeze” if you are not familiar with the different options
For example, if you set the loop back to 10, it will look up 10 bars back from the current price and let the strategy place trades if a squeeze is found within that range and stop all new trade after the squeeze is no longer detected. When set to zero, the strategy is turned off as soon as the squeeze ends.
GLOBAL TRADING FILTER
By enabling the Use Squeeze Filtering input, TRADOTO can take advantage of the Squeeze indicator with any automated trading mode by allowing trades to be taken only when the price action is in Squeeze mode or within a number of bars following a squeeze as specified in the “Squeeze Loop Back” input . When no squeeze are detected , the strategy is switched OFF until a squeeze appears again.
This section lets you configure how the strategy manages your daily unrealized and realized PnL combined.
01. Daily Target PnL
Stop trading after this much realized and unrealized profit is reached for the day (reset daily at the end of the day)
02. Daily Stop PnL
Stop trading after this much realized and unrealized loss (use a positive value) is reached for the day (reset daily at the end of the day) i.e. 400 = a loss of 400
03. Profit to Breakeven
After this much profit is reached, move stop PnL to breakeven
04. Breakeven Offset
When PnL is moved to breakeven, offset it by this much profit (for example, if set to 200, the strategy will disable itself and close all positions if the realized and unrealized profit combined reaches $200)
05. Profit to Trail
After this much realized and unrealized profit is reached, start trailing PnL. Set to a large value to disable
06. Trail Amount
Once trailing is enabled, trail PnL by this much profit (for example, if set to 400, the strategy will stop trading if the realized and unrealized profit combined drop by over $400)
This section lets you configure when the strategy will be active, which day of the week and what part of the day.
We provide 4 different time filters, meaning you could have the strategy start and end 4 different times on the same day. This is useful if you wish to avoid certain timeframe during the day. Say for example there is a major event scheduled on your traded instrument at 10AM daily, you want to have the strategy disabled at that time. To do that we will have to set two time filters to TRUE, the first active filter will be from the beginning of the day to say 9:55AM and the second time filter will be from 10:05AM to end of day.
You are welcome to swing trade using our strategy, an open position will not be closed at the end of the day if you have the TIME IN FORCE input set to GTC (Good ‘Til Canceled). Though, do keep in mind that the informative CLOSED PNL box in the lower left corner will reset to 0 daily at midnight.
Trade (DayOfTheWeek)
Specify which day of the week the strategy will be active
Use Time Filter?
Set to TRUE to enable a time range in which the strategy will be active
Trade Start Time
Specify the exact time the strategy will be enabled. Use this format HH:MM:SS
Trade End Time
Specify the exact time the strategy will be disabled. Use this format HH:MM
Close position at every end time [New in v4]
Tells the strategy to close open positions for every end time specified, useful to ensure that no trade are open between time filters.
Close position at latest end time [New in v4]
Tells the strategy to close open positions at the last end time specified, required to ensure that all trades are closed at the end of the trading session.
The Economic News Filtering & Trader let’s you trade precisely and safely huge volatile price action moves caused by scheduled market economic news events.
More details coming soon
Input series
Set your instrument to trade here. This will be set automatically based from which chart window you added the strategy
Add indicators to chart?
When ENABLED, the indicators that the strategy uses will be added to your chart. This feature is very useful when reviewing trades taken in theSTRAEGY ANALYZER window under the chart tab as this tab cannot use a custom chart template.
Sets the way that simulated historical orders will be processed by the strategy. See the Understanding Historical Fill Processing page for more information.
Exit on session close
When enabled, open positions will be closed on the last bar of a session
Exit on session close seconds
Sets the number of seconds prior to the end of a session at to close any open positions held by the strategy
Stop & Target submission
Sets how stop and target orders are submitted. Leave default unless familiar with those options
The time in force for an order defines the length of time over which an order will continue working before it is canceled
Time in force
Select either GTC or Day
DAY – A Day order is canceled if it does not execute by the close of the trading day. Unless otherwise specified, every order is a Day order.
GTC – A Good-Til-Canceled order will continue to work within the system and in the marketplace until it executes or is canceled.
This lower right corner button let you load and save strategy templates. very handy during optimization and when trading multiple instrument to quickly go back and forth between different configurations.
Download the latest NT8 version and install it using the default settings.
We require your Ninja Trader MachineID in order to enable your use of the TRADOTO strategy that you purchased from us. Use the form below to submit it.
That information can be found from the Help > About menu in NinjaTrader. It is a string of 32 alphanumeric characters, with no dashes. Please be sure that you do not submit your NinjaTrader License ID.
The TRADOTO strategy can be licensed and used on one machines. If you plan to upgrade your computer hardware or replace it with a new one, you must resubmit your new MachineID to us before the strategy can be used again.
If you need to run TRADOTO on two platforms simultaneously, you can add a second machine ID to your account by purchasing it HERE
You can download the latest version of TRADOTO and review our strategy change log below. We also email all active members every time we release a new version.
Version 5.0 (New - April 2020)
NEW TRADING MODE
– New trading mode leveraging the popular Pivot indicator. You can now trade your favorite support and resistance pivots levels fully automated with our fully featured order management Algorithm, enjoy!
NEW FEATURE
– Revamped strategy layout to speed up learning curve and facilitate optimization
– You can now enter on pullback with a pre defined offset to optimize your entry price event more!
– New input to let you ignore cloud position in relation to price to increase trading flexibility when using the Ichimoku trading mode
– You can now trail your stop based on the last support or resistance level!
– Added new input to avoid entry on choppy price action when using the swing trading mode
– New algorithm to close a partially filled entry position when STOP/TARGET is hit to avoid having a re-entry on the remaining unfilled position.
– Added new input to bypass T/K alignment when using the Cloud Break Trader
– HiLo trader filtering input can now be applied globally to all trading modes
– Swing entry offset can now be used with a negative value to place trades before support or resistance levels are broken
– Improved fill accuracy with TopStepTrader pre-funded accounts
Version 4.0
NEW TRADING MODE
– Introducing two brand new trading modes leveraging the Ichimoku indicator, see user manual for all the details.
NEW FEATURE
– New and improved strategy control panel layout
– Brand new trading mode to leverage the popular ichimoku indicator
– New input to let you trade in one direction, short or long. This can be helpful in some markets where you see that the daily chart is extremely bearish or bullish.
– New merged trading execution mode to let you see historical trades while trading LIVE
– You can now specify your position sizing in quantity or “Capital to risk” to let TRADOTO dynamically calculate the number of contract/shares to buy depending on the capital entered.
– You like to use percentage to calculate how far your target an stop should be? you can now do that thanks to the “Target/Stop calculation method” input.
– Added input to pause the strategy X number of bars between trades to avoid over-trading when using lower timeframes.
– You can now define the minimum squeeze duration before the strategy is turned on.
– Added input to either close position at the last time filter only or all the time even between time filters.
– New order exit method leveraging the Ichimoku indicator for improved trailing method.
– HiLo trader filtering input can now be applied globally to all trading modes
– Swing entry offset can now be used with a negative value to place trades before support or resistance levels are broken
– v4.0.1.6: Added new input to bypass T/K alignment when using the Cloud Break Trader
– v4.0.1.14: Implement new algorithm to close a partially filled entry position when STOP/TARGET is hit to avoid having a re-entry on the remaining unfilled position.
BUGFIX
– v4.0.1.5: Fix input naming typo and resolve minor conflict when combining the hilo filtering with itchimoku
– v4.0.1.6: Fix HiLo filtering conflict when used with other trading indicator modes
– v4.0.1.9: Fix historical trading engine inaccuracy with stops and tailing caused by the latest NT platform version update.
– v4.0.1.12: Improve partial fills handling when using stop limit entries
– v4.0.1.14: Resolve error when enabling news filter
– v4.0.1.16: Resolve PnL sync issue with TopStepTrader Data feed
Version 3.0.1.15
NEW FEATURE
– Added Squeeze box to the chart in order to easily visualize when the market is in squeeze (default when using the TRADOTO template)
– Added new ROLLOVER indicator: Shows a button on the chart in the upper right corner to roll the instrument to the front month (default when using the TRADOTO template)
– Added market economic news filters to easily cancel trading when the market is volatile
– Added a new “Economic News Filtering” trading mode to trade market economic news events
– Added input to leave open position open when the end time filter is reached to let ongoing trade close via STOP or TARGET
– Added input to pause the strategy when a trade ended using HiLo trader to avoid overtrading situations if the price stays within the entry zone for too long
BUGFIX
– Optimizes the order management engine to improve speed and accuracy when working with high volatility markets.
– Recode how the order management handles stops distance to allow the stop to be placed closer to the entry point (useful when trading forex)
Version 2.1.0.2
NEW FEATURE
– Added info message next to PnL counter in lower left corner when daily max profit/loss is reached: “Daily Limit reached – trading stopped”
– Added pop up error message when disabling strategy with open position: “Strategy disabled with open position – check your position to be sure it is as you desire”
– Added pop up error message when strategy is unable to fill an order due to a platform or brokerage problem: “Strategy stopped due to rejected entry order – verify that you are flat”
BUGFIX
– Error handling engine has been revised from [cancel everything & close position] to only ignore errors as this was introducing conflicts with the platform default error handling actions.
– Resolved issue where a time filter or stop order was rejected resulting in open positions
Version 2.1.0.1
NEW FEATURE
– A brand new trading mode is being introduced called HiLo Trader. It allows the strategy to trade of HiLo Crossovers. More details can be found in the User Manual.
– Indicators can now be plotted on the chart while using the Strategy Analyzer window by enabling the “Add indicators to chart?” under the DATA SERIES section.
– The control panel layout has been revamped to bring the most accessed section to the top.
BUGFIX
– We’ve resovled a bug that was causing the strategy to crash by trying to submit an order in historical mode instead of real-time while connected to SIM.
Version 2.0.14.0
BUGFIX
– NinjaTrader version 8.0.5.2 introduces new codes for order management on strategies. We’ve included those new languages to be fully compatible with this latest release
Version 2.0.10.0
NEW FEATURE
– Strategy Analyzer back-testing reliability has been improved in the latest version of Ninjatrader 8.0.5.2, our strategy code has now been updated to fully take advantage of this tool (see STRATEGY OPTIMIZATION tab for more details)
BUGFIX
– Resolve a bug where the strategy was trying to cancel an order already pending cancellation.
– Fixed a HiLo indicator sound alert option that wasn’t working.
Version 2.0.8.0
NEW FEATURE
– Improved layout to speed up enabling and disabling the strategy from the chart. The most useful sections are now pinned to the top and least useful ones moved to the bottom. Please review the user manual for clarification.
BUGFIX
– Resolve an issue where the breakeven PnL feature would be stuck in a loop
– Enabling the squeeze indicator was preventing the strategy from running
Version 2.0.6.0
NEW FEATURE
– Automatically close active and pending trades after the platform loses connection to the exchange and reconnect. To enable this new feature, be sure to enable the KEEP RUNNING handling feature as detailed on the CHANGE OPTIONS starting guide tab.
BUGFIX
– Resolve intermittent issue where a position is left without stop loss and targets.
– Correct Closed PnL syncing issue when a trade is closed after reaching time filter end time.
Version 2.0
NINJATRADER 8
Our strategy is now compatible with NinjaTrader 8.
STRATEGY TEMPLATES
This was our most requested feature, the ability to save and load templates to speed up the optimization process, we’ve now added support for templates, enjoy!
OPPOSITE MODE
We were seeing a lot of trading opportunities where taking reversal trades was very profitable in certain trading hours and with the right offset for entry. This feature will let the strategy place a LONG trade where it would usually go SHORT or go SHORT where a LONG would occur.
REAL TIME PNL MONITORING
Previously the STOP and TARGET PnL was acting only on the realized PnL (closed trades), this often made the strategy go beyond the max loss/profit on the day by ignoring ongoing/unrealized trades. Starting in version 2, the PnL management will be done in real time by actively monitoring the unrealized PnL as well.
PNL BREAK EVEN & TRAILING
This new feature adds break end and trailing to the daily target PnL as soon as the combined unrealized/realized target PnL is reached on the day. This will avoid being in the green at the start of the day but ending the day in the red.
Version 1.0
This is the only version compatible with NinjaTrader 7. If you would rather use our strategy on NT7, please follow the V1 Starting Guide and review the V1 User Manual linked below. We still provide BUGFIX support for version 1 but new features are only added for the NT8 platform going forward as the coding is drastically different between NT7 and NT8..
Follow the steps pictured below to import your strategy ZIP file, after step 3 pictured below, find the TRADOTO ZIP file and open it to start the import process. After the import complete, restart the NinjaTrader platform
If you are upgrading to a newer version of our strategy, you might encounter this error upon importing the strategy.
To avoid this problem, ensure you have removed any strategy added on charts or from the strategy tab. Then follow the steps below:
If the import is still failing after removing the NinjaScript Assembly as shown above, please manually remove the strategy files as follow.
Lastly, if both solutions above didn’t help, please perform a NT8 factory reset as shown below:
Next let’s add your data provider/broker connection so the platform can connect to the exchange and receive market data. if you haven’t signed up with on, you can review compatible brokers on this page http://ninjatraderecosystem.com/Brokers.php
Your broker will provide you the configuration details. For your reference, here is how the Ninja CQG provider connection is added: http://ninjatrader.com/ConnectionGuides/CQG-Connection-Guide
NinjaTrader offers FREE live futures data (not delayed) for SIM trading by signing up HERE. The connection expires after a few weeks, at which point you can renew again from the same page and using the same email address or fund a real account to use a permanent connection to the exchange.
Setup your chart and instrument by following the steps below.
If you are trading futures, be sure to rollover your instruments on the expiration date. See 2nd picture below for more details on how this is done in NinjaTrader 8
TIP: to delete instrument from the instrument list after adding from the lookup tool, simply highlight it on the list and press DEL on your keyboard
Once your machine ID has been submitted and registered, you can enable the strategy using two different approaches, both pictured below. Method 1 is done from the chart and method 2 from the control center strategy tab
Please note that with method 2 it will not display the closed pnl counter in lower left corner on the chart.
Pictured below is how the TRADOTO strategy is enabled on the chart, be sure to make changes to it or disabled it from the chart as well by disabling the strategy first and clicking APPLY. Mixing Method 1 and method 2 (shown below) could produce platform issues, always use the same method.
Please only enable one strategy per chart. Simply open a new chart window to trade additional instruments
Once your strategy has been enabled from the strategy tab as pictured below, be sure to make changes to it or disabled it from the strategy tab as well. Mixing Method 1 and 2 could result in some platform issues, always use the same method.
The best way to quickly assimilate what each input in our strategy does, is to setup a workspace with a monitor dedicated to the TRADOTO User Manual and the secondary monitor for your favorite chart instrument with a few days of historical data to play with. (you can increase the number of days loaded on the chart by right clicking on an empty spot on the chart > DATA SERIES > DAYS TO LOAD)
With this workspace, you’ll be able to quickly study each input and how they impact trading result by flipping the strategy ON/OFF after making minor adjustment. The changes you make will reflect instantly on the chart by showing you where the entry and exit would have been taken (as pictured below). A good exercise is to analyze the trade taken on the chart and improve them by slowly altering each inputs until the day is very profitable, this helps build a very strong understanding on how our strategy works. Be sure to practice with all TRADING MODE we offer so you can then focus your OPTIMIZATION phase with your favorite exclusively (more details on the this phase is found in the BACKTEST OPTIMIZATION tab after)
After playing with historical data, we advise taking it to the next level by running your configuration in REPLAY MARKET to see the trade enfold in REAL TIME, this is more time consuming but very eye-opening so be sure to spend time on that as well. You can learn more about MARKET REPLAY in the next tabs.
Before using our strategy on the LIVE market, it is required to find your optimal strategy configuration using BACKTEST.
Optimizing your strategy means going over multiple weeks/months of market price action to see how a strategy configuration performs longer term. Before optimizing, be sure to fully understand all the strategy parameters covered in the user manual. Once this all make sense, you’ll want to start testing several configuration iterations using BACKTEST in the strategy analyzer window.
The first step to determine the validity of a trading idea is to backtest your configuration versus historical market data. Backtesting helps you identify quickly a potentially effective strategy configuration and serves as a starting point. Backtesting provides a bird’s eye view of how your strategy configuration may perform in a real-time trading environment. Testing various configurations and observing their results is an excellent way to get started and get different ideas brewing.
Backtest results generated with our strategy are accurately representating live trading trades, keep in mind that minor differences can be found from time to time as backtest works with 4 data points per candle (OHLC: Open/High/Low/Close) while real-time trading provides a tick by tick data feed which is way more detailed than backtest. For the closest profit representation, we recommend using the market replay mode, visit the market replay optimization tab for more details on this step. If you are seeing a lot of different result between your LIVE and BACKTEST trade, make sure that you are using the HIGH FILL RESOLUTION mode (not STANDARD) at the bottom of the tradoto control panel as this will ensure the NinjaTrader trading engine is provided with the most historical price action details, more details on this feature here.
In this two videos, we will go over how the strategy analyzer tool works and how backtest optimization is performed with our strategy. For more details on the Strategy Analyzer tool, you can consult the official NT manual as well.
Our backtest templates for futures are useful to speed up your learning curve using the strategy analyzer but aren’t meant to be used as is on your LIVE trading account, further optimization will be required to match your trading style, account size and risk tolerance. All template deliver reliable and constant historical return over at least a 6 months trading history. Each template helps our member visualize different profitable configuration that uses various trading style, bar type, trading hours, etc…
To use our template, simply launch the Strategy Analyzer and follow the numbered steps below
1. Select our Strategy from the dropdown menu: TRADOTO.COM
2. Click TEMPLATE at the bottom of the strategy panel and select LOAD
3. Double click the “TRADOTO Templates” folder and select a template to try
4. Click OPEN
5. Select the latest contract month instrument (aka front month) used in the template you selected. To be sure you are using the latest one, click the LOOKUP icon beside the instrument drop down, search for the instrument and select it, the platform will always grab the latest front month that way.
6. Set your desired start and end date to backtest, keep in mind that most historical data provider only offer a year worth of tick data.
7. Ensure you are connected to your broker to retrieve the historical data needed to generate this report and then click RUN (running a backtest while being disconnected or connected to a data feed without historical data like playback or EOD data will not work)
8. (not pictured) Our template are created from on the Eastern Standard time zone (EST). You will have to either set your operating system time zone to that (NY Time) or adjust the start and end time filter inputs in the strategy to match your own local time zone.
For example, using 1 contract with a stop distance of 20 ticks or 2 contract with a stop of 10 ticks will cost you $200 per bad trade when trading Crude Oil which cost $10 per tick, in that case set your max daily loss to -400 to allow two bad trade in a row at least.
Once a profitable configuration is found through backtesting, expanding testing to MARKET REPLAY will help validate your results in a real time simulated environment.
Market Replay is the ability to replay market data it as if it was happening in real-time. You can trade in simulation against this data at varying levels of replay speed. This feature bring the most accuracy in strategy results, it is the best way to confirm that your strategy configuration (optimized in backtest) is working as expected.
The video below will walk you through how this feature works in NinjaTrader.
We strongly advise to setup text notification alerts on your phone to be alerted immediately when an error occurs on your platform, this is crucial to have when away from the computer!
Below is a list of known e-mail provider settings demonstrating e-mail alerts configuration within NinjaTrader.
For step 7 pictured below, you’ll need to enter your personal email provider server settings, if your domain configuration isn’t listed under the picture, please research online what you should be using for your own email server.
Lastly in Step 7, the EMAIL ADDRESS field should be your phone carrier text messaging email address in order to receive alerts directly on your phone via SMS, if you unsure what it is, please research online or call your phone carrier to ask them (this should be the format: yourphonenumber@yourcarrierdomainname)
AOL:
Please note the user name may or may not contain “@aol.com”.
Server: smtp.aol.com
Port: 587
SSL: Enabled
User: “YourUserName” or “YourUserName@aol” Note: New accounts require “@aol.com” in username.
Password” “YourPassword”
GMAIL:
Please note the user name does NOT contain the “@gmail.com”.
Server: smtp.gmail.com
Port: 587
SSL: Enabled
User: “YourUserName”
Password” “YourPassword”
HOTMAIL:
Please note the user name contains the “@hotmail.com”.
Server: smtp.live.com
Port: 587
SSL: Enabled
User: “YourUserName@hotmail.com”
Password” “YourPassword”
YAHOO:
Please note the user name does NOT contain the “@yahoo.com”. Also you must enable ‘POP’ within your email account as shown HERE
Note: Yahoo may require a paid account for utilization of the SMTP/POP services.
Server: smtp.mail.yahoo.com
Port: 587
SSL: Enabled
User: “YourUserName”
Password “YourPassword”
Once your mail setup is complete, please test your configuration as pictured below to ensure you are receiving SMS alert on your phone. Simply set the HiLo Activator and the SWING indicator to FALSE, then enable the strategy to trigger the error pictured, an SMS alert will be sent to your phone within the next 10 seconds.
Automated trading strategies leave pending orders on your broker servers waiting to be filled. When the internet connection goes down where the strategy is running, the pending order is left running on the broker side unattended, this means that if the price action hit that order, the platform running the strategy won’t be online to submit the usual stop and limit orders to manage the active trade.
For this reason, you must be aware when the internet goes down so you can promptly cancel any pending order left on the broker end and reconnect your strategy when the internet is back up
There are many websites that offer monitoring services, to start monitoring your home internet connection, you must ensure you have a STATIC IP address, then you can enable monitoring using a site like this one http://uptimerobot.com/ (to receive SMS alert instead of email, simply set the primary email to the same email address used in the MOBILE SMS TEXT NOTIFICATION tab above, that email will relay new emails to your phone number directly)
Another option is to setup your platform on a trading Virtual Private Server (aka VPS). Those dedicated server are hosted offsite close to the exchange for faster fill and will have a static IP address. You can then use their server static IP address with your monitoring site. Here is NinjaTrader recommended VPS provider http://www.ninjatraderbrokerage.com/hosting_services
To ensure the strategy can cancel all pending and active orders In case your platform loses internet access, we need to advise the NinjaTrader 8 platform to leave the strategy running when the platform loses and restore internet access. Please follow the step below to do so:
Also we recommend to Uncheck the “confirm order placement” option as pictured below to avoid the repetitive warning pop up every time the strategy is turned on:
Most markets become highly volatile when important news event surface. It is highly recommended that you anticipate when those events occur to either turn off the strategy in order to avoid slippage or customize it to maximize profits and safety.
Here is a list of popular economic calendar sites, some even offer mobile application to receive alerts on your smart phone (filter the importance of the news to only show medium and high events and focus only on the instrument you are trading of course).
By default, your computer will go into sleep mode after a period of inactivity. in order for TradOTO to run 24/7 your computer must remain powered on all the time, watch this video to learn how this is done on a Windows 10 computer:
After a few months of LIVE trading with great results, we recommend migrating your platform in the cloud for greater reliability/uptime and reduce your slippage with a server located closer to the exchange.
This cloud hosted server solution also lets you easily remote access your TRADOTO platform from anywhere, even your phone.
We advise to setup your VPS with the Windows Server 2012 operating system (version 2019 will require more ressources to run at similar speed), at least 3GB RAM and a CPU with 2 cores. Our recommended VPS provider is VPSSERVER which offers those hardware specifications for as low as $29.99/m, you can sign up for a 7 day free trial using the button below.
Submit the form below if you have a monthly subscription and wish to upgrade it to LIFETIME or cancel it.